

Introduction
Materials and Methods
Animals, slaughter, and dissection
Computed tomography
Image analysis
Statistical analysis
Results and Discussion
Estimates of muscle and fat contents in the cuts
Conclusion
Introduction
As of 2022, Koreans’ consumption of the three major meats (pork, beef, and chicken) per person is 60.6 kg, a significant increase from 31.9 kg in 2000, and it continues to steadily rise (KREI 2024.03). Among these, the consumption of pork is 30.1 kg, exceeding 50% of the total meat consumption. As a major food ingredient, not only taste and nutrition but also functionality, safety, and quality are becoming increasingly important (Kim and Kim, 2009).
A pork carcass is made up of various parts, each with a unique taste, texture, and economic value. Currently, the grading standards for pig carcasses are divided into primary meat volume standards and secondary meat quality standards, and a single grade is assigned to the whole carcass by combining meat volume and quality (Bae et al., 2016). However, at the retail stage, the quality of pork cuts often does not meet consumer expectations compared to pork grade, leading to dissatisfaction with carcass grading and increasing the demand for pork cuts quality labeling (Lim, 2018).
Current grading systems based on warm carcass evaluation are not suitable for evaluating the quality of unexposed meat parts, making it difficult to assess the meat quality of specific cuts (Kim et al., 2024). On the other hand, physical dissection-based traditional methods enable the assessment of the quality of individual pork cuts, but these methods involve additional costs, demand more manpower, are time-intensive, and most importantly, can introduce subjectivity depending on the evaluator’s expertise and experience (Monziols et al., 2006; Prieto et al., 2009; Kim et al., 2023).
Muscle contributes to increasing the elasticity and quality of meat, and fat in pork improves the texture and flavor of meat. Thus, an appropriate muscle-to-fat ratio plays an important role in determining the taste and texture of meat (Rosenvold and Andersen, 2003; Monziols et al., 2006; Kim et al., 2024). Therefore, it is very important to judge meat quality by accurately assessing the ratio of muscle and fat.
Recent technological developments have introduced a variety of non-invasive/non-destructive advanced technologies (spectroscopy, radiology, computed tomography [CT], and magnetic resonance imaging [MRI] etc.) that can evaluate the composition of animal body tissues have been introduced, making accurate and objective evaluation possible (Baulain et al., 2004; Bünger et al., 2011; Wu et al., 2022). Previous research on various non-invasive/non-destructive methods reported that among CT, MRI, and ultrasound scanning, CT was the method with the highest coefficient of determination between predicted and actual measurements (R2 < 0.99) (Scholz et al., 2015).
Few studies have examined the correlation between meat quality evaluation of the whole carcass and the muscle-to-fat volume ratio of specific parts such as pork belly and neck. Most studies assessing pork quality typically use the loin (e.g., longissimus thoracis or longissimus lumborum), but questions are commonly raised in the industry as to whether the loin is representative of overall carcass quality (Bohrer et al., 2024). To address these questions, this study used CT to investigate the correlation between the muscle-to-fat volume ratio of pork belly and pork neck, which are widely consumed by Koreans, and the overall carcass, and to provide basic data on the muscle-to-fat volume ratio.
Materials and Methods
Animals, slaughter, and dissection
The present study was conducted on 21 crossbred (Duroc × [Landrace × Large white]) gilt carcasses of grade 1+ with an average live weight of 115 kg. The animals were slaughtered following the standard procedures of the Korea Livestock Product Evaluation Institute at a slaughterhouse approved for the humane management and use of animals. The left half-carcass was used in this study. At 24 h after slaughter, the Boston butt and pork belly were dissected from the carcass for imaging examination.
Computed tomography
Slice thickness/interval adjustment and program optimization were performed to select an efficient imaging sequence for evaluating fat and muscle mass through preliminary imaging examination of the carcass before scanning the carcass.
Each of the 21 Boston butt, pork belly and half-carcass underwent scanning on a 32-detector-row CT scanner (AlexionTM, Toshiba, Japan) with parameters set to 120 kVp, 150 mAs, 1 mm slice thickness, 0.75 s rotation time, and 0.938 collimation beam pitch. The CT images, displaying a soft tissue window (40 hounsfield units [HU] level, 400 HU width), were extracted using Xelis software (INFINITT Healthcare, Korea).
Image analysis
The image obtained from CT scans was checked through the picture archiving and communication system (PACS). The volume of muscle and fat in the pork belly and shoulder butt of cross-sectional images taken by CT was estimated using Vitrea Workstation version 7 (Vital Images, USA). To calculate the muscle and fat content within the pork belly and shoulder butt, areas with the corresponding HU values on the CT scans were primarily identified manually. While the Vitrea software aided with semi-automated detection of contiguous regions exhibiting similar HU values, manual adjustments were frequently made to exclude any undesired areas. These selected regions were aggregated from each slice. Subsequent to this, the gathered data was processed using the Vitrea post-processing software to determine the volumes, which were measured in milliliters (mL). In addition to volume calculations, a three-dimensional reconstruction of the organ of interest was generated.
Statistical analysis
Pearson’s correlation coefficient was used to evaluate the strength and direction of linear relationships between variables (the muscle and fat volume ratio of carcass and pork cuts). A positive correlation indicates that as muscle mass increases, fat mass tends to increase, and vice versa. Conversely, a negative correlation indicates an inverse relationship. Statistical significance of correlations was confirmed at a confidential interval of 95% using GraphPad Prism 8 (GraphPad Software Inc., USA).
Results and Discussion
Estimates of muscle and fat contents in the cuts
During the CT scan of the half-carcass and pork cuts (pork belly and Boston butt), the absorption rate, which varies depending on muscle and fat density, was represented as a 3D image expressed in HU using reconstruction technology (Font i Furnols and Gispert, 2009) and displayed in Fig. 1. As a result of CT scan and automatic calculation using the Vitrea Workstation, the muscle-to-fat volume ratio was 1 : 0.58 for half-carcass, 1 : 0.86 for pork belly, and 1 : 0.37 for Boston butt. As a result of the CT analysis of the correlation coefficient between Boston butt and pork belly according to the meat-fat volume ratio, the correlation coefficient and coefficient of determination are shown in Table 1. There was a negative correlation of -0.9608 between Boston butt and carcass, and the coefficient of determination was 0.9231. Pork belly and carcass showed a positive correlation of 0.7423, and the coefficient of determination was 0.5510.
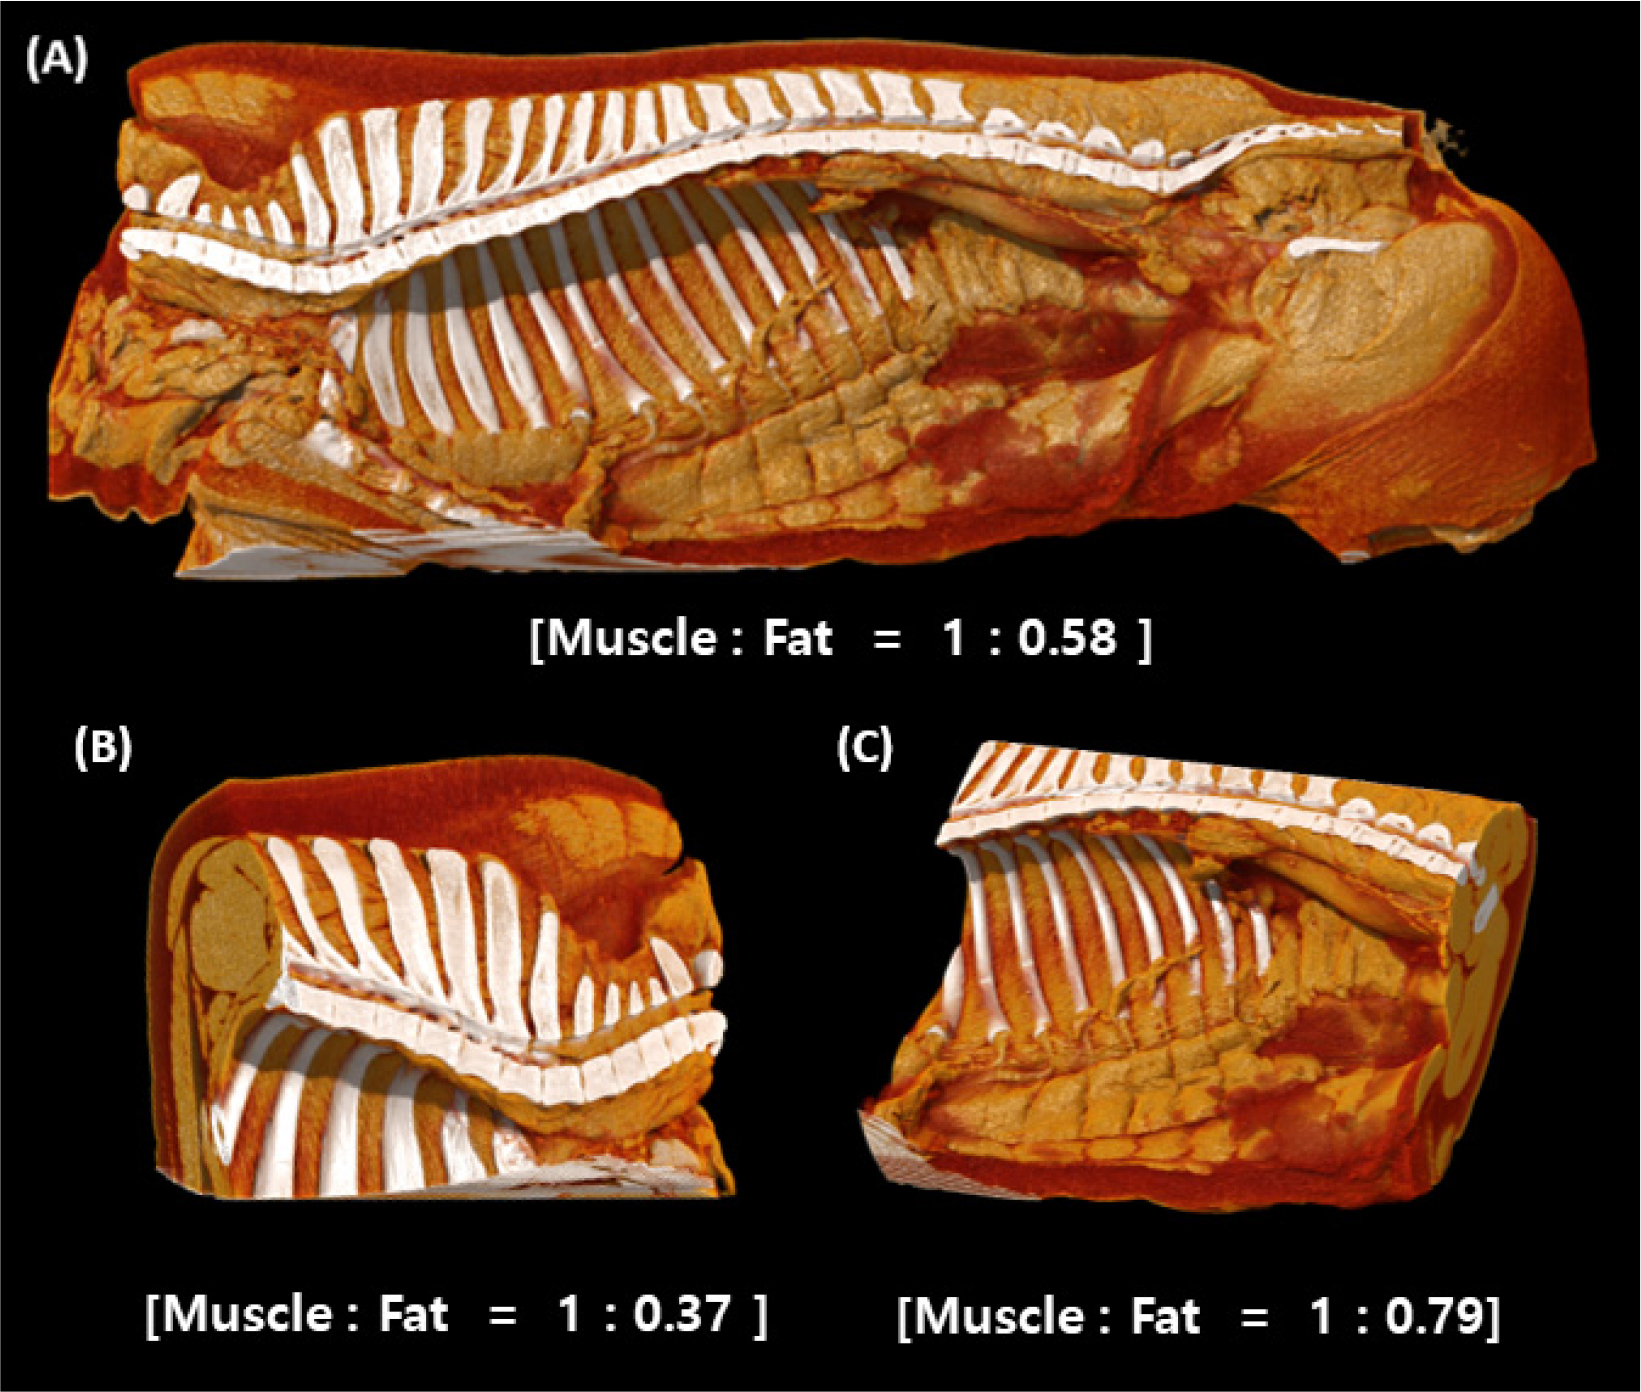
Table 1.
Correlation and determination coefficients of muscle to fat volume ratio in carcasses and pork cuts (Boston butt and pork belly).
| Item | Half-carcass | |
| Boston butt | Pork belly | |
| R | -0.9608 | 0.7423 |
| R2 | 0.9231 | 0.5510 |
| p-value | 0.179 | 0.468 |
Bohrer et al. (2024) that although the majority of studies evaluating pork quality typically use loin muscles (e.g., longus thoracis or longus lumborum) for analysis, quality varies across the entire pork carcass and at different locations within the same muscle. These differences highlight the need to better understand the quality trait relationships between the different muscles of the pork carcass.
Dissection-based chemical analysis is the best way to measure body composition, but is time-consuming and limited to being performed only once on the same sample due to carcass loss (Szabo et al., 1999; Monziols et al., 2005; Kloareg et al., 2006). Many studies have been conducted to overcome these limitations. Previous studies have reported that CT has already proven its safety, as it is used for human diagnostic purposes (Szabo et al., 1999; Collewet et al., 2005; Monziols et al., 2005), and that it can be an important tool for safely estimating body composition in animals because the principles of CT scanning are closely related to tissue density (Szabo et al., 2001; Goodpaster, 2002). Romvári et al. (2005) reported correlations of 0.97 for lean mass and 0.95 for fat content, thereby demonstrating the accuracy of CT predictions by comparing CT scan measurements with traditional slaughter results. For this reason, applied research has been conducted on various animals using CT to measure body composition of living animals or fat content of carcasses (Font i Furnols and Gispert, 2009; Prieto et al., 2010; Kongsro and Gjerlaug-Enger, 2013; Lambe et al., 2013; Narsaiah et al., 2019; Silva et al., 2020). In particular, a previous study by Navajas et al. (2010) evaluated that CT scanning can be a highly accurate, rapid, non-invasive/non-destructive method to evaluate body/carcass composition. Other previous studies have reported that CT can accurately predict intramuscular fat content through muscle density of carcass (Prieto et al., 2010; Lambe et al., 2013). In relation to this, a previous study by Szabo et al. (1999) reported that R2 values for predicting lean and fatty tissue content of carcasses were in the range of 0.58 to 0.98 and 0.79 to 0.81 respectively. However, although the correlation coefficient was quite high, it has been noted that the equation had poor repeatability with respect to the evaluation method, indicating the need for continued research. Previous studies have reported that CT technology can non-invasively evaluate tissue composition in living animals. However, studies utilizing this method to investigate the correlation between muscle-to-fat volume ratios in specific areas, as in this study, are difficult to find, further emphasizing the need for continued research. In addition, for broader implementation of CT assessment methods, it is crucial to address several significant considerations. Previous studies have reported that post-mortem studies are influenced by physicochemical changes (including intramuscular water loss and fat crystallization). Therefore, the estimation of muscle and fat content of carcasses through CT imaging still requires further research, such as by making improvements and tracking changes over time.
Conclusion
CT is a non-invasive method that can accurately evaluate the composition of body tissue. This study investigated the correlation between the muscle-fat volume ratio of the parts of meat (Boston butt, pork belly) that are not visible or identifiable in the half-carcass state, which is the target of pork carcass grading, and the characteristics of the half-carcass using CT imaging technology. The study results revealed a negative correlation between Boston butt and carcass, and a positive correlation between pork belly and carcass, confirming that there was a significant correlation between muscle and fat volumes. Therefore, the results of this study are expected to provide objective data that can be used as reference for predicting and grading the quality of carcasses. However, this study also emphasizes the need for further research to address the limitations related to postmortem physicochemical changes and to improve the accuracy and repeatability of CT-based evaluation.
