

Introduction
Materials and Methods
Ethics
Animals, treatments and pre-slaughter conditions
Carcass quality measurements
Pork composition and quality
Behavior observation
Blood profile
Statistical analysis
Results
Carcass quality measurements
Pork composition and quality
Behavior observation
Blood profile
Discussion
Conclusion
Introduction
Lairage acts as a crucial pre-slaughter handling process, offering a rest period to mitigate stress and fatigue caused by transportation and unloading, hence averting the deterioration of meat quality (Hemsworth et al., 2002). Further, lairage conditions may lessen the impact of both short-term or long-term ante-mortem stressors, which affects muscle metabolism, meat color, shelf-life and technological yields (Van der Wal et al., 1999; Gispert et al., 2000). However, poor lairage management (such as stocking density and time) is often accompanied due to economic losses by increased stress (Newman et al., 2014). It has been documented that deficient lairage management escalates the incidence of PSE (pale, soft, exudative) and DFD (dry, firm, dark) conditions, leading to compromised pork quality. Consequently, extensive research has been undertaken to identify the ideal lairage management strategies that could minimize lairage-induced stress.
Lairage stocking density is one of the stressful factors that affects meat quality. When pigs are under high stocking density (HD), it induces stress with aggression and increases fighting behavior in lairage (Turner et al., 2000). Supportably, previous studies have indicated that elevated stocking density boost aggressive behavior with fighting, culminating in inferior pork quality (Ewbank and Bryant, 1972; Driessen et al., 2020). Conversely, numerous studies have suggested that low stocking density (LD) could also foster stress by enhancing aggressive behavior (0.59 and 0.86 m2, respectively) (Moss, 1978; Rabaste et al., 2007). Additionally, stress engendered by unsuitable stocking densities elevates blood lactate and cortisol levels while depleting muscle glycogen reserves, leading to elevated pH values after 24 h and an increased frequency of PSE or DFD meat (Warriss et al., 1998). Therefore, inappropriate lairage stocking density could result in increased skin lesions with stress, detrimentally affecting the pork quality of pig carcasses (Driessen et al., 2020).
Numerous researchers have confirmed that lairage time is a primary source of variation determining pork quality (Costa et al., 2002; 15Dokmanović et al., 2014okmano). Studies have shown that either absent or extremely brief lairage periods (15 - 60 min) can heighten fatigue in pigs, as evidenced by elevated blood cortisol levels and aggressiveness at the slaughter period, higher muscle temperatures (18℃), and increased muscle lactic acid, resulting the PSE meat (Owen et al., 2000; Shen et al., 2006). In contrast, Faucitano (2010) have revealed that extended lairage time augment the risk of DFD meat and carcass weight losses. Also, Guàrdia et al. (2005) has reported that the risk of incidence of DFD meat increases by 12% to 25%, between 3 h to overnight lairage time. In fact, lairage time (resting time) is variable depending on the lairage area size and livestock delivery schedule (Geverink et al., 1996; Gispert et al., 2000). According to the animal slaughter detailed regulations of the Animal and Plant Quarantine Agency of Korea, animals are required for rested for adequate time (5 - 6 h), not to exceed 12 h (Lee et al., 2023). However, there are lack of studies that evaluation of lairage time between 0 - 4 h with 5 - 8 h in Korea.
The interaction between lairage stocking density and time is complex, with a notable dearth of statistical investigations into their combined effects. Given the variety of factors that influence pig stress during lairage, it is imperative to conduct a thorough assessment of the implications of lairage stocking density and time. Thus, this study aims to elucidate the impacts of lairage stocking density and time on pork quality, carcass grading, behavior, and the blood profile in slaughter pigs.
Materials and Methods
Ethics
Chungbuk National University’s Institutional Animal Care and Use Committee in Cheongju, Korea reviewed and approved the protocol of this study (approval no. CBNUA-2185-23-02).
Animals, treatments and pre-slaughter conditions
This study was conducted in the Republic of Korea, during the spring. All of the pigs were reared on the same commercial farms and then transported to the same commercial slaughterhouse. A total of 607 mixed-sex crossbred fattening pigs (Duroc × [Yorkshire × Landrace], LYD) weighing between 115 and 120 kg at live weight were used. Pigs were transported across a distance of 40 km, traveling with 15 journeys, which is the number of cities passed during the transportation. On the day of the slaughter, pigs were moved early in the morning from the farm to the slaughterhouse. At arrival, pigs were transported to lairage pens and rested in different stocking density with different lairage time. Pigs, which were moved in groups were kept together without mixing with other groups. Every pig was slaughtered in accordance with the Livestock Sanitation Management Act’s regulations. Additionally, although there were variations in the slaughter times, all pigs were killed on the same day. Lairage stocking density treatments were as follows: HD (lower than 0.5 m2 / 100 kg pig); ND, normal stocking density (0.5 m2 / 100 kg pig to 0.83 m2 / 100 kg pig); LD (higher than 0.83 m2 / 100 kg pig). Lairage time treatment was as follows: ST, short time (0 to 4 h); LT, long time (4 to 8 h).
Carcass quality measurements
The pig carcasses grade system followed the Korean Pig Carcass Grade System, as shown in Fig. 1 (MAFRA, 2023). An electronic scale was used for 45 min postmortem to measure the weight of the hot carcass weight, which was showed in integer kg units. Backfat thickness was determined by using a left half carcass. Additionally, the length between the 11th and 12th thoracic vertebrae, the first lumbar vertebra, and the last thoracic vertebrae was measured by using a ruler, in order to assess the thickness of the backfat thickness. The formula (backfat thickness [mm] per hot carcass weight [kg]) was used for calculating the hot carcass weight and backfat thickness.
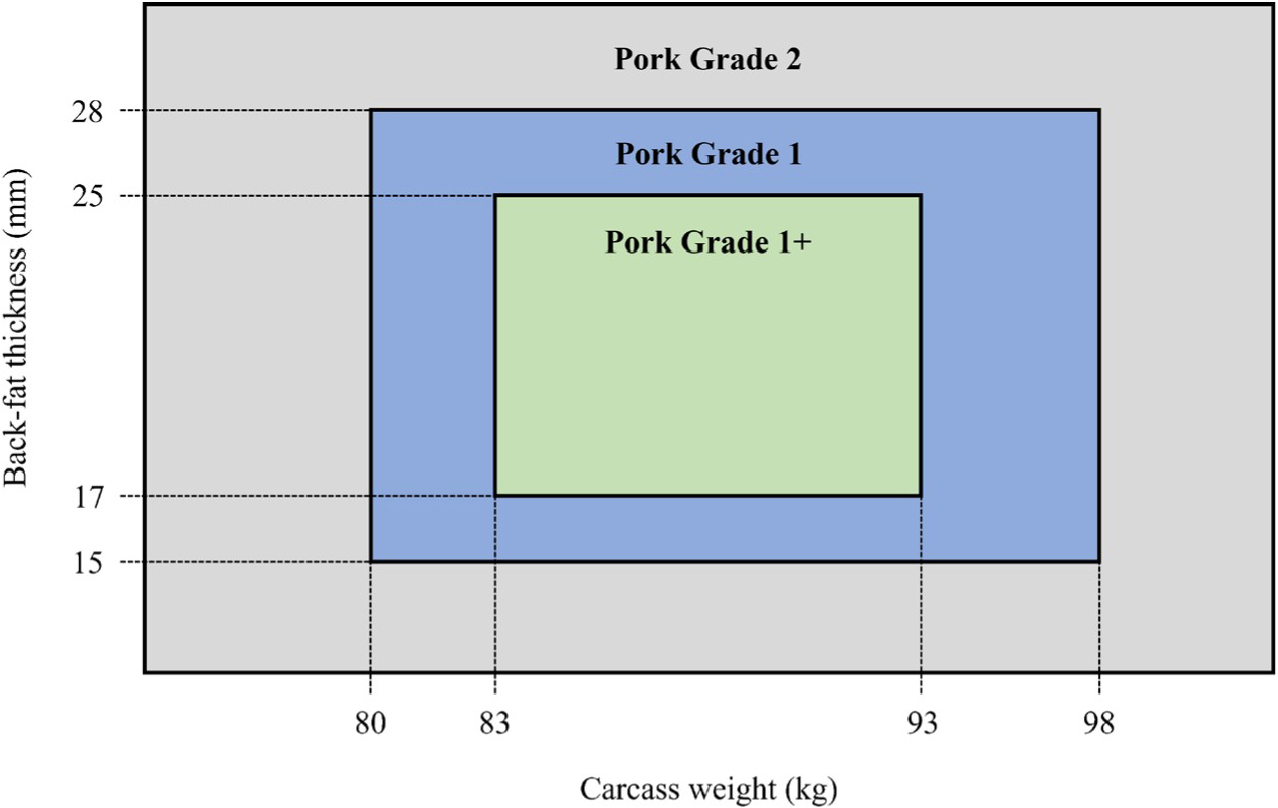
Fig. 1.
Korean carcass grading system according to carcass weight and backfat thickness. Adapted from MAFRA (2023).
Pork composition and quality
According to the standard recommendation by the AOAC International (2000), the moisture, protein, and fat content (%) was analyzed. To measure the pH, 50 mL of distilled water was added to 5 g of the left carcass loin. After homogenizing all of the samples for 30 s with a homogenizer, the pH of each sample was measured using an Orion StarTM A211 pH Benchtop Meter (Thermo Fisher Scientific Inc., USA), which was calibrated at pH 4, 7, and 10. Left carcass loin was analyzed with a Spectro Colorimeter standardized on a white plate (L*, 89.39; a*, 0.13; b*, -0.51) to determine the meat color. During this period, a white-fluorescent lamp (D65) served as the light source. Color values were featured as L* (lightness), a* (redness), b* (yellowness). Drip loss (DL) was determined by using the filter paper wetness (FPW) test. The weight loss that occurred when suspending a standardized muscle sample (40 - 50 g, or about 30 mm × 60 mm × 25 mm) in an airtight container for 48 h at 4℃ was quantified as DL, and the weight disparities were taken into account. According to Oliveira et al. (2014) methodology, cooking loss (CL) was determined. For determination of CL, a meat sample was divided into 1 × 1 × 1 cm from each animal. Samples were weighed and then kept overnight at 4℃. The samples were continuously cooled to ambient temperature once the sample’s external temperature reached 85℃, and then they were weighed to determine the CL. The weight of the initial sample divided by the weight of the heated sample to calculate the CL value, which showed as a percentage. Following the Koćwin-Podsiadła et al. (2006) methodology, pork quality classes were measured by using light reflectance (L*), DL fluctuations, and pH values evaluated 24 h postmortem (Table 1).
Table 1.
Evaluation of pork quality classes.
| Pork quality classz | pH24h | Drip loss | L* value |
| PSE pork | < 6.0 | ≥ 5 | ≥ 50 |
| RSE pork | < 6.0 | ≥ 5 | 42 - 50 |
| RFN pork | < 6.0 | 2 - 5 | 42 - 50 |
| PFN pork | < 6.0 | 2 - 5 | ≥ 50 |
| DFD pork | ≥ 6.0 | ≤ 2 | < 42 |
PSE, pale, soft, exudative; RSE, reddish-pink, soft, exudative; RFN, red, firm, non-exudative; PFN, pale, firm, non-exudative; DFD, dark, firm, dry.
z Adapted from MAFRA (2023).
Five skilled panelists evaluated the sensory color. Determination of sensory colors grade system is shown in Table 2. Marbling was determined by the Detailed Standards for Livestock Product Grading, as shown in Table 2 (MAFRA, 2023). The intra-measurement co-efficient of variance for pork quality parameters were less than 10%.
Table 2.
Evaluation sensory colors and marbling grading system.
| Grade | Sensory colors | Marblingz |
| Score 1 | Pale | Practically devoid |
| Score 2 | Grayish pink | Slight |
| Score 3 | Reddish pink | Modest |
| Score 4 | Purplish red | Slightly abundant |
| Score 5 | Dark | Abundant |
z Adapted from MAFRA (2023).
Behavior observation
Real-time pig behavior monitoring was conducted using cameras placed on the lairage ceiling. The position of pigs was divided into basic behavior (standing, sitting, and lying) and singularity behavior (aggression, overlap). Description of pig behavior was followed An et al. (2023) methodology. Only recordings with a minimum of 7 pigs in each group that could be clearly seen were examined for the measurement because the compartment group was not always entirely seen by the camera.
Blood profile
Blood samples were obtained as soon as the throat was severed during the exsanguination process, at slaughter. Blood samples were obtained from 10 pigs in each group from jugular vein for the analysis of concentration of cortisol, glucose and lactate. Serum samples were collected and centrifuged at 3,000 × g for 20 min at 4℃. Subsequently, samples were kept in a -20℃ refrigerator until analysis. To measure the serum cortisol concentration levels, cortisol kits (radioimmunoassay Coat-A-Count) were used. Following the manufacturer’s instructions, the concentration of serum glucose was determined by an automatic Kone-lab analyzer. To measure the lactate concentration levels, GM7 Analox analyzer used.
Statistical analysis
Two-way ANOVA was used to analyze the data for the impacts of three distinct lairage stocking density types (HD, ND, LD) with two different types of lairage time types (ST, LT), as well as their interactions, were examined, with litter serving as a covariate. To analysis all of data, the GLM procedure of SAS (Version 9.4, SAS Institute Inc., USA) were used. Tukey’s multiple range test was used to find differences between treatment means. The pooled standard error was used to express the data’s variability. A probability level of p < 0.05 was shown to be statistically significant, and a level of 0.05 ≤ p < 0.10 was thought to have such a tendency.
Results
Carcass quality measurements
Effects of lairage stocking density and time on meat quality measurements are presented in Table 3. As shown in Table 3, backfat thickness was significantly increased (p < 0.05) in HD compared with LD. Also, in carcass grade, LD showed numerically increased incidence of Grade 1+ compared with HD. Furthermore, ST showed numerically increased incidence of Grade 1+ compared with LT.
Table 3.
Effects of lairage stocking density and lairage time on carcass quality.
| Items | D | T | SEM | p-value | |||||
| HD | ND | LD | ST | LT | D | T | D × T | ||
| N | 196 | 171 | 240 | 294 | 313 | - | - | - | - |
| Carcass composition traits | |||||||||
| Hot carcass weight (kg) | 87.97 | 88.06 | 87.68 | 88.25 | 87.56 | 0.570 | 0.785 | 0.146 | 0.524 |
| Backfat thickness (mm) | 23.37a | 22.49ab | 21.67b | 22.36 | 22.66 | 0.539 | 0.008 | 0.497 | 0.634 |
| Carcass grade scorez (%) | |||||||||
| Grade 1+ | 34.95 | 40.11 | 44.92 | 40.32 | 39.84 | - | - | - | - |
| Grade 1 | 36.02 | 33.16 | 31.02 | 33.33 | 33.42 | - | - | - | - |
| Grade 2 | 29.03 | 26.74 | 24.06 | 26.34 | 26.74 | - | - | - | - |
D, lairage stocking density; T, lairage time; HD, high stocking density (lower than 0.5 m2 / 100 kg); ND, normal stocking density (0.5 m2 / 100 kg to 0.83 m2 / 100 kg); LD, low stocking density (higher than 0.83 m2 / 100 kg); ST, short time (0 to 4 h); LT, long time (4 to 8 h); SEM, standard error of the mean.
Pork composition and quality
Effects of lairage stocking density and time on pork quality classes are presented in Table 4. As shown in Table 4, water holding capacity (WHC) was significantly higher (p < 0.05) in LD compared with HD. Also, CL was significantly lower (p < 0.05) in LD compared with HD. In pork quality classes, LD showed numerically decreased incidence of PSE pork than MD and HD.
Table 4.
Effects of lairage stocking density and lairage time on pork composition and quality.
| Items | D | T | SEM | p-value | |||||
| HD | ND | LD | ST | LT | D | T | D × T | ||
| Pork composition (%) | |||||||||
| Moisture | 73.09 | 73.13 | 73.09 | 73.36 | 73.41 | 0.569 | 0.250 | 0.916 | 0.459 |
| Crude protein | 21.44 | 21.13 | 21.44 | 21.45 | 20.95 | 0.651 | 0.799 | 0.353 | 0.439 |
| Crude fat | 2.23 | 2.23 | 2.23 | 2.10 | 2.43 | 0.231 | 0.874 | 0.083 | 0.496 |
| Pork quality parameters | |||||||||
| pH | 5.51 | 5.55 | 5.56 | 5.57 | 5.51 | 0.086 | 0.856 | 0.384 | 0.822 |
| WHC (%) | 66.59b | 67.27ab | 68.58a | 67.34 | 67.62 | 0.735 | 0.027 | 0.642 | 0.320 |
| DL (%) | 4.74 | 4.78 | 4.61 | 4.85 | 4.56 | 0.270 | 0.797 | 0.190 | 0.782 |
| CL (%) | 24.33a | 23.80ab | 23.41b | 23.91 | 23.78 | 0.367 | 0.048 | 0.655 | 0.970 |
| L* value | 53.05 | 52.10 | 50.93 | 51.32 | 52.73 | 1.284 | 0.259 | 0.183 | 0.829 |
| a* value | 6.69 | 6.33 | 6.39 | 6.39 | 6.55 | 0.323 | 0.487 | 0.548 | 0.952 |
| b* value | 5.75 | 5.64 | 4.90 | 5.56 | 5.30 | 0.569 | 0.272 | 0.584 | 0.629 |
| Sensory evaluation | |||||||||
| Sensory colorx | 2.88 | 2.79 | 2.82 | 2.91 | 2.76 | 0.164 | 0.878 | 0.264 | 0.259 |
| Marblingy | 3.21 | 3.22 | 3.27 | 3.26 | 3.20 | 0.232 | 0.963 | 0.788 | 0.672 |
| Pork quality classes (%) | |||||||||
| PSE pork | 16.67 | 3.33 | 3.33 | 13.33 | 4.44 | - | - | - | - |
| RSE pork | 3.33 | 10.00 | 6.67 | 4.44 | 4.44 | - | - | - | - |
| RFN pork | 66.67 | 63.33 | 60.00 | 66.67 | 62.22 | - | - | - | - |
| PFN pork | 13.33 | 23.34 | 30.00 | 15.56 | 28.90 | - | - | - | - |
| DFD pork | 0.00 | 0.00 | 0.00 | 0.00 | 0.00 | - | - | - | - |
D, lairage stocking density; T, lairage time; HD, high stocking density (lower than 0.5 m2 / 100 kg); ND, normal stocking density (0.5 m2 / 100 kg to 0.83 m2 / 100 kg); LD, low stocking density (higher than 0.83 m2 / 100 kg); ST, short time (0 to 4 h); LT, long time (4 to 8 h); SEM, standard error of the mean; WHC, water holding capacity; DL, drip loss; CL, cooking loss; PSE, pale, soft, exudative; RSE, reddish-pink, soft, exudative; RFN, red, firm, non-exudative; PFN, pale, firm, non-exudative; DFD, dark, firm, dry.
Behavior observation
Effects of lairage stocking density and time on pig behavior is presented in Table 5. As shown in Table 5, LD showed significantly (p < 0.05) lowest sitting behavior compared with MD and HD. Also, HD showed significantly (p < 0.05) highest sitting behavior compared with MD and LD.
Table 5.
Effects of lairage stocking density and lairage time on pig behavior.
D, lairage stocking density; T, lairage time; HD, high stocking density (lower than 0.5 m2 / 100 kg); ND, normal stocking density (0.5 m2 / 100 kg to 0.83 m2 / 100 kg); LD, low stocking density (higher than 0.83 m2 / 100 kg); ST, short time (0 to 4 h); LT, long time (4 to 8 h); SEM, standard error of the mean.
Blood profile
Effects of lairage stocking density and time on blood profile is presented in Table 6. As shown in Table 6, LD showed significantly (p < 0.05) decreased cortisol concentration compared with HD.
Table 6.
Effects of lairage stocking density and lairage time on blood profile.
D, lairage stocking density; T, lairage time; HD, high stocking density (lower than 0.5 m2 / 100 kg); ND, normal stocking density (0.5 m2 / 100 kg to 0.83 m2 / 100 kg); LD, low stocking density (higher than 0.83 m2 / 100 kg); ST, short time (0 to 4 h); LT, long time (4 to 8 h); SEM, standard error of the mean.
Discussion
Before slaughter, pigs endure stress due to the sequential processes they undergo in lairage. Previous research indicates that increased pre-slaughter stress levels during lairage can lead to alterations in body homeostasis and metabolism, manifesting as changes in the physio-metabolic blood profile (hormones, metabolites, and enzymes), which in turn, degrades the quality of both the carcass and pork (Choe et al., 2014; Čobanović et al., 2017; Sommavilla et al., 2017). Thus, determining the optimal lairage stocking density and duration to mitigate stress is paramount for enhancing animal welfare and pork quality.
In this study, we noted an elevation in cortisol concentrations attributable to HD. Cortisol is a biochemical indicator of stress, which has been used to evaluate the stress (Tang et al., 2021). High stocking densities not only reduce available living space but also exacerbate the environmental load on pigs, manifested by the presence of harmful gases and an increased incidence of respiratory and digestive tract diseases (Cornale et al., 2015). According to Dalla Costa et al. (2019), pigs handled with HD record higher serum cortisol concentration compared with LD. Similarly, Song et al. (2023) have demonstrated that pigs in higher stocking densities (lower than 0.5 m2 / 100 kg pig) during lairage experienced elevated cortisol levels compared to those in lower densities (higher than 0.83 m2 / 100 kg pig). Therefore, the results of increased cortisol concentration imply that HD induces stressful conditions before slaughter.
Carcass trait is deemed a significant factor influencing the profitability of pork producers (Alfonso et al., 2010). Notably, backfat thickness exhibits the negative correlation with the total loin meat yield and a positive correlation with intramuscular fat (Hoa et al., 2021). Considering that intramuscular fat contributes to enhanced pork quality, including aspects such as juiciness, tenderness, and flavor, a decreased backfat thickness (ranging from 21 - 25 mm) is advisable (Fortin et al., 2005; Wood et al., 2008; Hoa et al., 2019). In this study, higher stocking density was associated with increased backfat thickness, a finding in alignment with the study by Lee et al. (2023), which demonstrated a decrease in backfat thickness under stress-filled lairage conditions. Similarly, Song et al. (2023) reported that pigs subjected to high stocking densities and elevated temperatures exhibited increased backfat thickness. Čobanović et al. (2020) have reported that the cortisol level was associated with the increase in backfat thickness. Cortisol generally affects fat and protein metabolism by reducing protein synthesis and increasing its breakdown, while promoting fat storage in the presence of insulin (Edwards et al., 2010; Dokmanovic et al., 2015). These reasons explain why the increase in backfat thickness was associated with high cortisol levels in this study. In the current research, we noted a decrease in the incidence of Grade 1+ in conditions of HD. These outcomes indicate that high stocking densities compromise carcass traits due to lairage stress. However, Čobanović et al. (2016) have suggested that there was no significant difference in backfat thickness about stocking density. The difference of results might be attributed to slaughter weight, sex, and environment.
WHC is a paramount quality parameter affecting pork quality, as it reduces weight loss during cutting and storage, and enhances the meat’s water retention capacity during storage (Lawrie, 1980). Additionally, reduced WHC leads to the denaturation of sarcoplasmic proteins, culminating in increased CL in the pork (Warner et al., 2001; Li et al., 2012). Consistently, the findings of our study indicated diminished WHC and increased CL under conditions of HD, corroborating previous research which has shown that elevated pre-slaughter stress degrades WHC and leads to higher CL, thereby diminishing pork quality (Van der Wal et al., 1999; Støier et al., 2001; Aaslyng et al., 2003). Also, previous studies have elucidated that WHC could affect the incidence of PSE pork (Støier et al., 2001; Trevisan and Brum, 2020). When pigs are under stress, the myofibrillar protein reaches the isoelectric point, which minimizes the distance between thick and thin filaments and maximizes approximation between them. It makes it hard to link the filaments and molecules of water, thereby decreasing the WHC. Consequently, compromised WHC alters the reflection of incident light, giving rise to PSE pork (Trevisan and Brum, 2020). As a result, our study’s findings underscore that high stocking densities can degrade the pork quality classes due to increased stress levels.
As lairage provides restricted space, pigs suffer from pre-slaughter stress due to limited rest space availability and insufficient recovery of transport fatigue. Generally, the posture of pigs indicates the discomfort associated with limited rest space availability in the lairage (Urrea et al., 2021). Our study reveals that HD exacerbates sitting behavior while diminishing lying behavior. Sitting behavior usually implies certain discomfort for pigs, which suffer from the limited space availability to settle down and rest (Villa et al., 2009). Also, lying behavior is considered as a comfortable resting area and calmness (Olczak et al., 2015). This finding is corroborated by An et al. (2023), who reported increased sitting and decreased lying behaviors at high stocking densities, and Urrea et al. (2021), who found that low stocking densities were associated with increased lying behavior
In this study, we investigated the effects of lairage stocking density and lairage time on slaughter pigs. However, there were no significant differences in ST and LT on slaughter pigs. Most of previous studies, which have identified the effects of lairage time, evaluated the overnight lairage (over 20 h) compared with ST (0 - 3 h) (Dokmanovic et al., 2017; Salajpal et al., 2005; Choi et al., 2024). Also, according to Lee et al. (2023), who researched the effects of lairage time by path analysis, differences between 6 and 20 h of lairage time could directly affect the cortisol increase. Based on previous studies, the higher differences in lairage time should be considered to identify the optimal lairage time for improving pork quality and animal welfare.
Conclusion
The result of this study suggests the optimal lairage stocking density to improve pork quality and animal welfare. In this study, LD enhanced carcass quality, pork quality, pig behavior, and blood profile. However, there were no significant differences in lairage time. Therefore, LD could be the ideal condition for improving pork quality and animal welfare.
