

Introduction
Materials and Methods
Study site and plant material
UAV data acquisition
Image preprocessing
Deep learning model
Knot detection and localization
Model training
Replanting decision support
Accuracy assessment
Results and Discussion
Accurate identification of missing and low-vigor cabbage plants
Effectiveness of area-based classification for plant vigor assessment
Visualization and spatial analysis
Management practices and their impact on stand establishment
Limitations and future directions
Conclusion
Introduction
The global agricultural sector is confronting unprecedented challenges in the 21st century, including climate variability, rural population aging, labor shortages, and escalating labor costs, all of which jeopardize food security (Godfray et al., 2010). These challenges are particularly pronounced in East Asia, where climate change manifests as more frequent and intense extreme weather events, such as droughts, floods, and heatwaves (IPCC, 2023). Consequently, a transition towards climate-resilient and resource-efficient agricultural practices is imperative. This study addresses these challenges in the context of cabbage (Brassica oleracea var. capitata) production in South Korea, a crop of significant importance to the nation food security and agricultural economy (MAFRA, 2023). Agricultural sector of South Korea is experiencing a demographic shift characterized by rural aging and labor shortages, leading to increased reliance on costly and often inefficient manual labor (Kwon and Kim, 2014). Traditional crop health assessment methods, such as manual scouting, are inadequate for managing the spatial variability and rapid changes induced by climate change (Araus and Cairns, 2014). These factors underscore the urgent need for advanced, technology-driven solutions in crop monitoring and management that can minimize farmland management efforts, improve efficiency, and enhance resilience to climate-related stresses.
Specifically, early detection of stand establishment issues, such as missing or low-vigor plants, is crucial for timely intervention and minimizing yield loss. Several studies have explored the use of unmanned aerial vehicles (UAVs) for various crop monitoring applications. Zhang et al. (2019) demonstrated the application of UAV imagery in turfgrass field trials, highlighting its potential for high-throughput phenotyping. Zhang et al. (2002) provided a broad overview of precision agriculture, including the use of remote sensing technologies.
Deep learning techniques, particularly convolutional neural networks (CNNs), have also been increasingly applied in agriculture (Joshi et al., 2023). Ren et al. (2016) introduced the Faster region-based convolutional neural networks (R-CNN) architecture, which has become a widely used object detection model. He et al. (2017) developed Mask R-CNN, further advancing object detection and segmentation capabilities. However, many existing approaches rely on complex models or require specialized sensors (e.g., multispectral or hyperspectral cameras) (Sethy et al., 2022), which can increase costs and computational demands. Furthermore, few studies have specifically focused on the combined early detection of both missing and low-vigor plants using a streamlined, readily accessible approach.
This research proposes a streamlined and cost-effective framework for the early detection of missing or poorly established cabbage plants (knots), using UAVs equipped with RGB sensors, combined with a deep learning-based object detection model and simplified image processing techniques. The method was validated at the K-Smart Farm Organic Farm Innovation Demonstration Complex in Goesan-gun, South Korea. This study distinguishes itself by offering a computationally efficient approach that combines early detection of both missing and low-vigor cabbage plants using readily available RGB imagery and a simplified area-based vigor classification, enabling timely and cost-effective replanting interventions. This research overcomes the limitations of previous studies by (a) reducing computational complexity (The area-based classification method provides a computationally efficient alternative to complex deep learning models for vigor assessment), (b) enhancing timeliness (The UAV-based system enables rapid assessment, allowing for timely replanting, unlike time-consuming manual scouting), (c) lowering data requirements (The approach uses readily available RGB imagery, avoiding the need for expensive specialized sensors), (d) providing an integrated solution (The pipeline combines detection and vigor assessment, offering a comprehensive solution for stand establishment evaluation), (e) increasing spatial precision (The system generates a geo-referenced planting map, enabling precise replanting, unlike the imprecise nature of manual scouting), and (f) utilizing real time kinematic (RTK)-based geometric correction (Eliminating the need for traditional ground control points [GCPs]).
The primary objective of this study is to develop and evaluate a UAV-based system employing RGB imagery and a deep learning model for the efficient, early detection of poorly established cabbage plants, thereby guiding timely and informed replanting decisions.
Materials and Methods
Study site and plant material
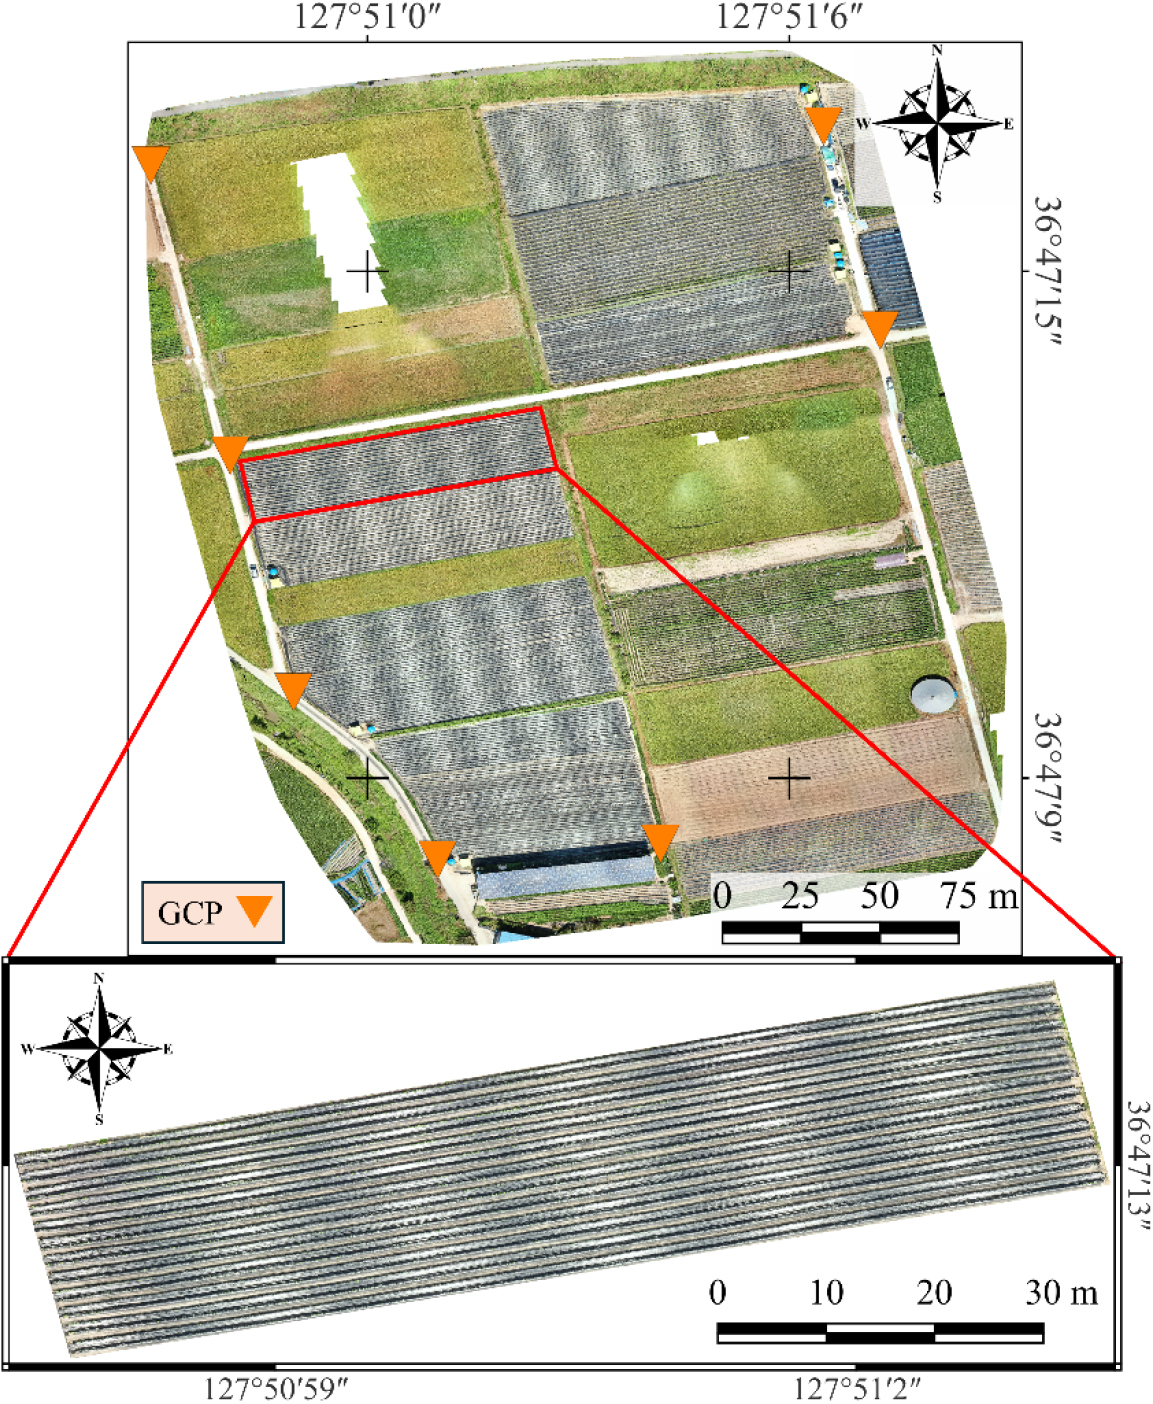
The research was conducted at the Smart Organic Farming Demonstration Complex located in Galeup-ri, Goesan-gun, Chungcheongbuk-do, South of Korea. The specific experimental plot within this complex encompassed 2,358 m2 and was equipped with a drip irrigation system. This plot was divided in half; one section was dedicated to the cultivation of cabbage and the remainder to Kimchi cabbage. The surrounding complex comprises five plots with a total area of 2.13 ha, all dedicated to cabbage cultivation. The cabbage cultivation site is specifically at 591 Galeup-ri, Chilseong-myeon, Goesan-gun. Fig. 1 illustrates the study area, with the red bordered region denoting the cabbage cultivation zone.
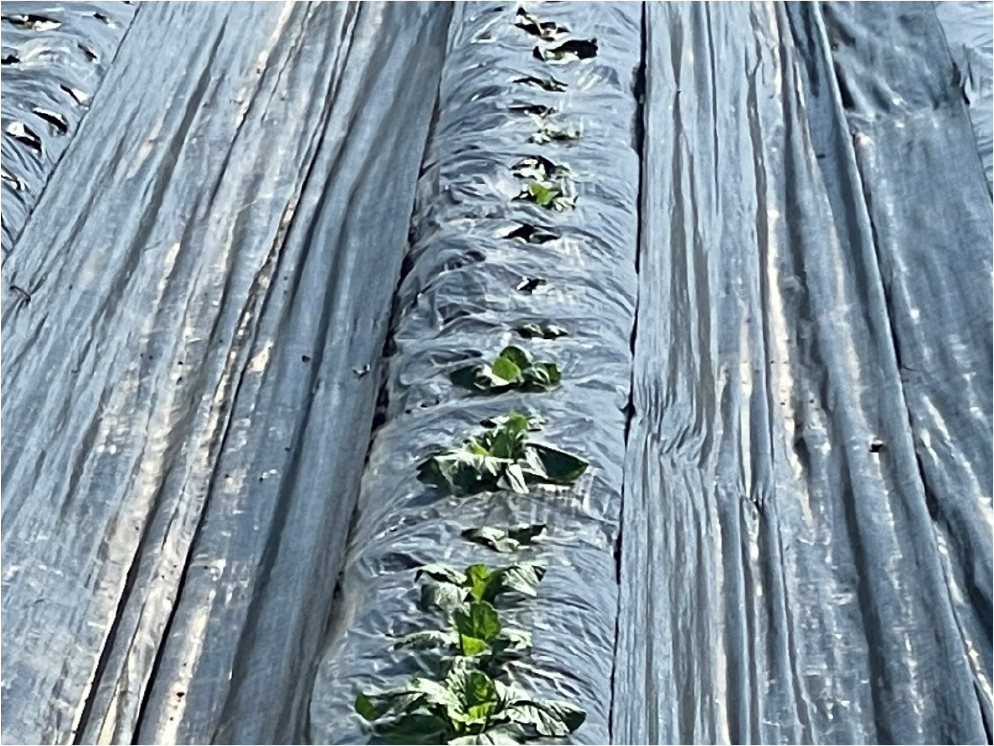
The cabbage (Brassica oleracea var. capitata) cultivar was planted on August 29, 2024, within the designated area of the experimental plot. This plot was intentionally neglected, receiving no supplemental irrigation or fertilization to simulate conditions of resource scarcity or management challenges (Fig. 2).
UAV data acquisition
High-resolution multispectral imagery of the cabbage testbed, including RGB data, was acquired on September 10, 2024, approximately two weeks after planting to capture early-stage growth. A DJI Matrice 300 RTK UAV (China) equipped with a MicaSense RedEdge-MX multispectral sensor (USA) was used for data collection. The sensor simultaneously captured image data across five distinct spectral bands: blue (475 ± 32 nm), green (560 ± 27 nm), red (668 ± 14 nm), red edge (717 ± 12 nm), and near-infrared (NIR) (842 ± 57 nm). The MicaSense RedEdge-MX, equipped with a 5.5 mm focal length lens, captured images with a resolution of 1,280 × 960 pixels in each band. The camera was triggered automatically to maintain the specified overlap. To minimize variations in solar illumination and ensure consistent data quality, all flights were conducted under clear sky conditions between 11:00 AM and 1:00 PM local time. The UAV was flown at a constant altitude of 40 meters above ground level, yielding a fine spatial resolution of 1.1 cm per pixel. To ensure sufficient data redundancy for subsequent image processing and orthomosaic generation, image overlap was maintained at 80% in the forward direction and 70% in the side direction. Additionally, seven GCPs were strategically placed throughout the study area and their precise coordinates were measured to facilitate accurate image georeferencing and orthorectification.
Image preprocessing
Prior to analysis, the acquired UAV RGB imagery underwent a series of preprocessing steps. First, a high-resolution orthomosaic of the study area was generated using Pix4Dmapper software (Pix4D, 2022). This involved radiometric calibration to reflectance values, utilizing a calibrated reflectance panel (RP04-1949205-OB, Labsphere, Inc., USA) imaged immediately before the UAV flight. Geometric correction and orthomosaic generation were then performed, leveraging the precise positional data from the DJI Matrice 300 integrated RTK system, eliminating the need for traditional GCPs. While orthomosaic generation can introduce some distortion, the use of RTK minimizes this, and the benefits of geometric accuracy and spatial context outweigh the potential drawbacks. The resulting orthomosaic maintained a spatial resolution of 1.1 cm·pixel-1. The innovative reliance on RTK technology for geometric correction represents a significant advancement for smart agriculture applications, enhancing both the practicality and efficiency of data processing in resource-constrained environments.
Subsequently, the orthomosaic was divided into individual image tiles, each resized to 224 × 224 pixels for compatibility with the ResNet-50 architecture. Feature maps were then extracted from these tiles using the ResNet-50 feature pyramid network (FPN), enhancing the contrast between healthy plants, stressed vegetation, and missing plants. Pixel values were then normalized using the ImageNet dataset statistics (mean = [0.485, 0.456, 0.406], standard deviation = [0.229, 0.224, 0.225]). The orthomosaic is necessary for providing a geometrically corrected, single image of the entire field, essential for accurate spatial analysis and comparison with the expected planting pattern, and for creating overview visualizations.
Deep learning model
For the detection of missing and low-vigor cabbage plants, a Faster R-CNN model incorporating a ResNet-50 FPN architecture was employed (Fig. 3). The ResNet-50 backbone, pre-trained on ImageNet, served as the primary feature extractor. Its architecture comprises five stages, with the initial stage (Basic Stem) consisting of a 7 × 7 convolution with a stride of 2, followed by batch normalization (BN), ReLU activation, and max pooling. Subsequent stages (Res2 to Res5) consist of multiple residual blocks. The output feature maps from Res3, Res4, and Res5, with spatial resolutions of H/8, W/8, H/16, W/16, and H/32, W/32, respectively, were fed into the FPN to generate multi-scale feature representations.
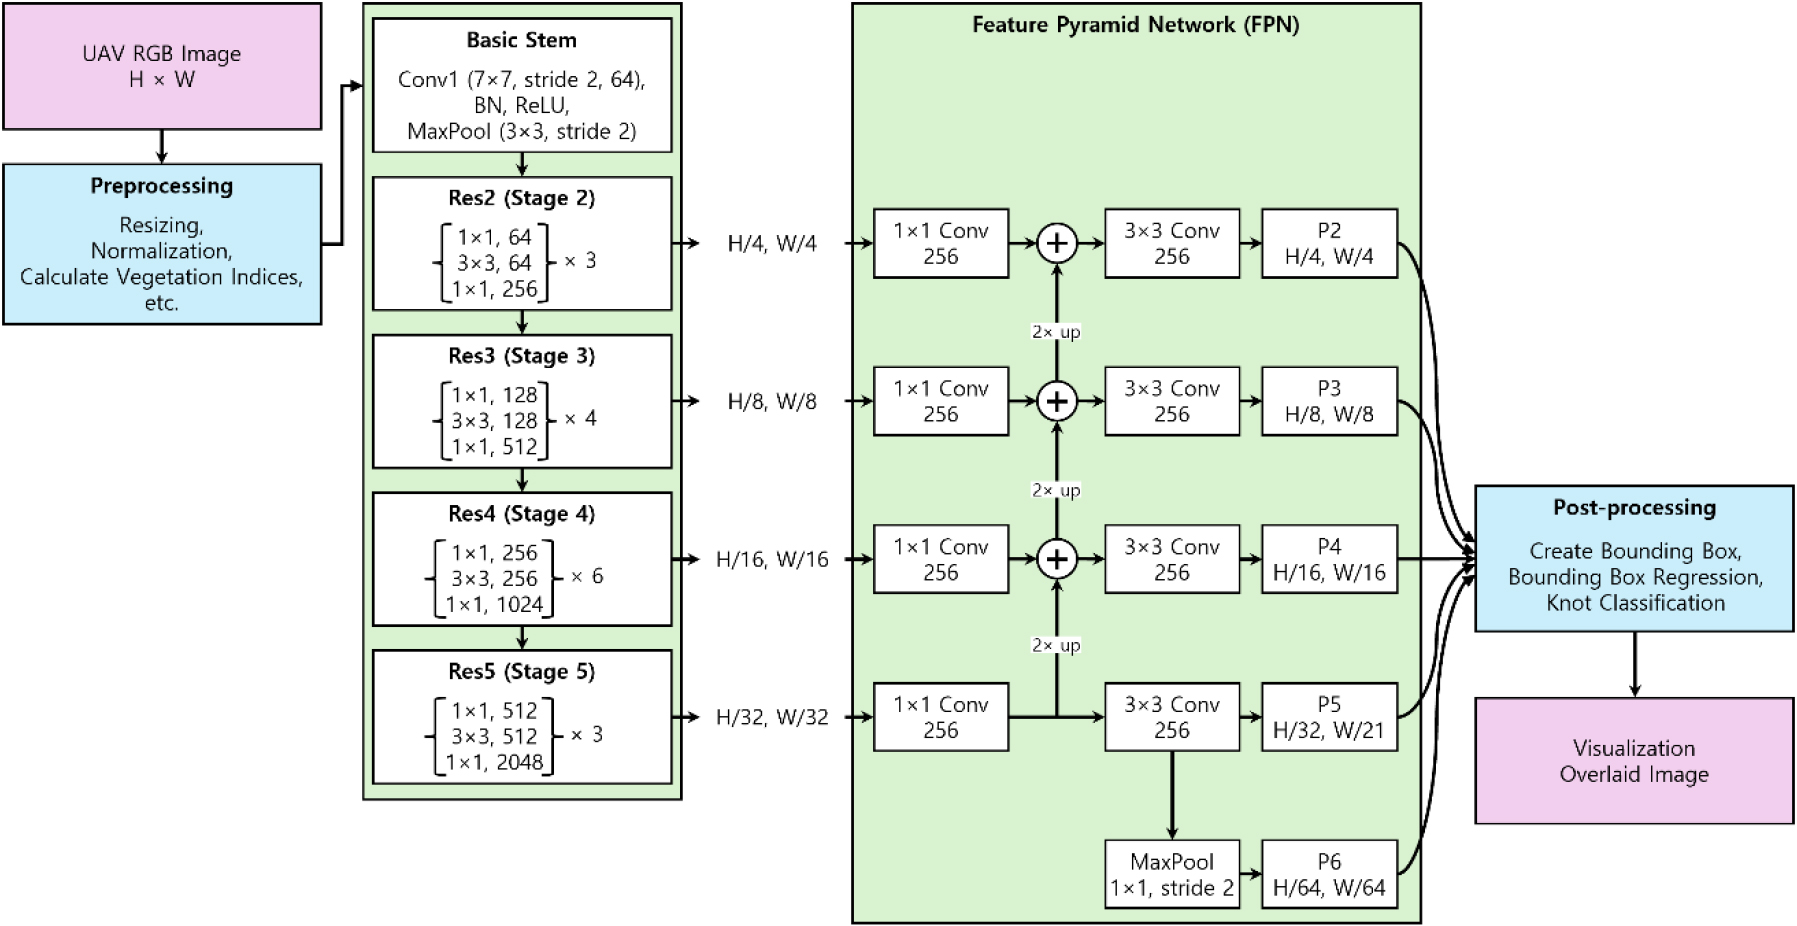
The FPN constructs a top-down pathway, where higher-level feature maps are upsampled and merged with corresponding lower-level maps via lateral connections. Each lateral connection involves a 1 × 1 convolution to reduce the channel dimensionality to 256. Element-wise addition is performed between the upsampled and laterally connected feature maps. Mathematically, this can be represented as Eq. (1).
where, is the output feature map at level , is the feature map from the corresponding ResNet stage, and represent 1 × 1 and 3 × 3 convolutions, and denotes the upsampling operation. The upsampling was performed using bilinear interpolation with a scaling factor of 2. Additionally, a 3 × 3 convolution with stride 2 is applied to the Res5 (Stage 5) output to generate the P6 feature map, which captures information at a coarser scale. The resulting multi-scale feature maps (P2 - P6) were then used by the Faster R-CNN’s region proposal network (RPN) for object detection and localization.
Knot detection and localization
For the detection and localization of missing (knot) and low-vigor cabbage plants, the Faster R-CNN framework with a ResNet-50 FPN backbone was employed. The term “knot” refers to a missing plant in the field. The RPN, a core component of Faster R-CNN, utilizes the multi-scale feature maps (P2 - P6) generated by the FPN to propose potential regions containing cabbage knots. Each proposed region was then classified as either “cabbage” or “background.” The model refines the coordinates of proposals classified as cabbage to generate precise bounding boxes. To accommodate the high resolution of the UAV imagery, a tiling strategy was implemented. The original orthomosaic was divided into 512 × 512-pixel tiles with a 20% overlap, ensuring complete coverage and contextual information. Pixel-level annotations of cabbage objects were created on image tiles and then used to generate bounding box annotations. The annotation process produced a dataset in the COCO format, suitable for training Faster R-CNN, using PNG masks to delineate object boundaries.
Model training
The Faster R-CNN model, employing a ResNet-50 FPN backbone, was trained using the PyTorch framework. The dataset was divided into training, validation, and test sets, comprising 60%, 20%, and 20% of the data, respectively. The training set consisted of 91 images with 4,270 bounding box annotations, while the validation set contained 31 images with 1,368 bounding boxes, and the test set included 31 images with 1,591 bounding boxes. Data augmentation techniques, including random rotations, horizontal flips, and brightness adjustments, were applied to the training set to enhance model generalizability and mitigate the effects of the relatively small dataset size.
Model training was conducted using the stochastic gradient descent (SGD) optimizer with a learning rate of 0.001, a momentum of 0.9, and a weight decay of 0.0005. The model was trained for 50 epochs with a batch size of 4. The loss function incorporated both cross-entropy loss for object classification and Smooth L1 loss for bounding box regression. Hyperparameters for the SGD optimizer were selected through a manual tuning process, optimizing the F1-score on the validation set. Learning rates between 0.0001 and 0.01, momentum values between 0.7 and 0.95, and weight decay values between 0.0001 and 0.001 were evaluated.
Replanting decision support
The developed system integrates plant detection and vigor assessment results to generate actionable information for precise replanting. This process comprises three key steps:
A. Missing (knot) Plant Identification: A grid of expected plant locations was generated based on the known field planting pattern, including row and in-row plant spacing. Comparing these expected locations with the actual plant locations identified through image analysis (Section: Knot Detection and Localization) enabled accurate identification of areas with missing plants.
B. Low-Vigor Plant Detection: To identify potentially stressed or poorly established plants, the average confidence score of the model within each detected plant’s bounding box was analyzed. Plants with a mean value below 0.05 were flagged as potentially low-vigor. This threshold was determined through a combination of visual image assessment and analysis of the model training value distribution across all detected plants.Iterative testing with different percentile values revealed a distinct separation in the area distribution, supporting the use of the 30th percentile as an effective threshold. Lower confidence scores generally indicate less certainty in the object detection, suggesting the plant may be smaller, less developed, or partially obscured, thus potentially indicating lower vigor.
C. Replanting Recommendation Generation: A geo-referenced map was created to highlight locations of both missing and low-vigor plants, providing essential guidance for replanting efforts. This map includes image coordinates of affected areas, the number of missing or low-vigor plants, and a severity level based on the mean model training value. The severity level aids in prioritizing replanting actions by indicating the degree of stress or poor establishment.
This system offers timely, efficient, and spatially precise replanting guidance, optimizing resource use and minimizing yield loss due to stand establishment issues. The approach leverages the spatial data from UAV imagery and the model’s outputs to provide actionable insights for targeted management interventions.
Accuracy assessment
Given the reliance on UAV-acquired data, a traditional ground-truthing approach was not employed for accuracy assessment. Instead, the accuracy of cabbage plant detection was evaluated using a combination of visual inspection and comparison with the expected planting pattern. First, detected plant locations were overlaid onto the original orthomosaic, enabling visual identification of obvious false positives (non-plant objects misidentified as plants) and false negatives (missed plants). This step provided a qualitative evaluation of detection accuracy.
Second, a quantitative assessment was performed by comparing detected plant locations with a grid representing the expected planting pattern. This grid was generated using the known row spacing and in-row plant spacing. This comparison facilitated the calculation of the missing plant rate (MPR) using the following Eq. (2).
The MPR provides an indirect measure of recall, specifically focusing on the proportion of plants not detected by the algorithm. This approach, while potentially less precise than traditional ground-truthing, offers a practical and efficient means of assessing detection accuracy in resource-constrained settings or when ground access is limited, enabling rapid evaluation in real-world agricultural applications.
While this method may introduce some error, particularly in areas with dense weeds or highly irregular planting, it provides a reasonable estimate of the overall MPR. The visual inspection component helps mitigate the risk of significant overestimation or underestimation.
Results and Discussion
Accurate identification of missing and low-vigor cabbage plants
Model performance and cabbage plant detection
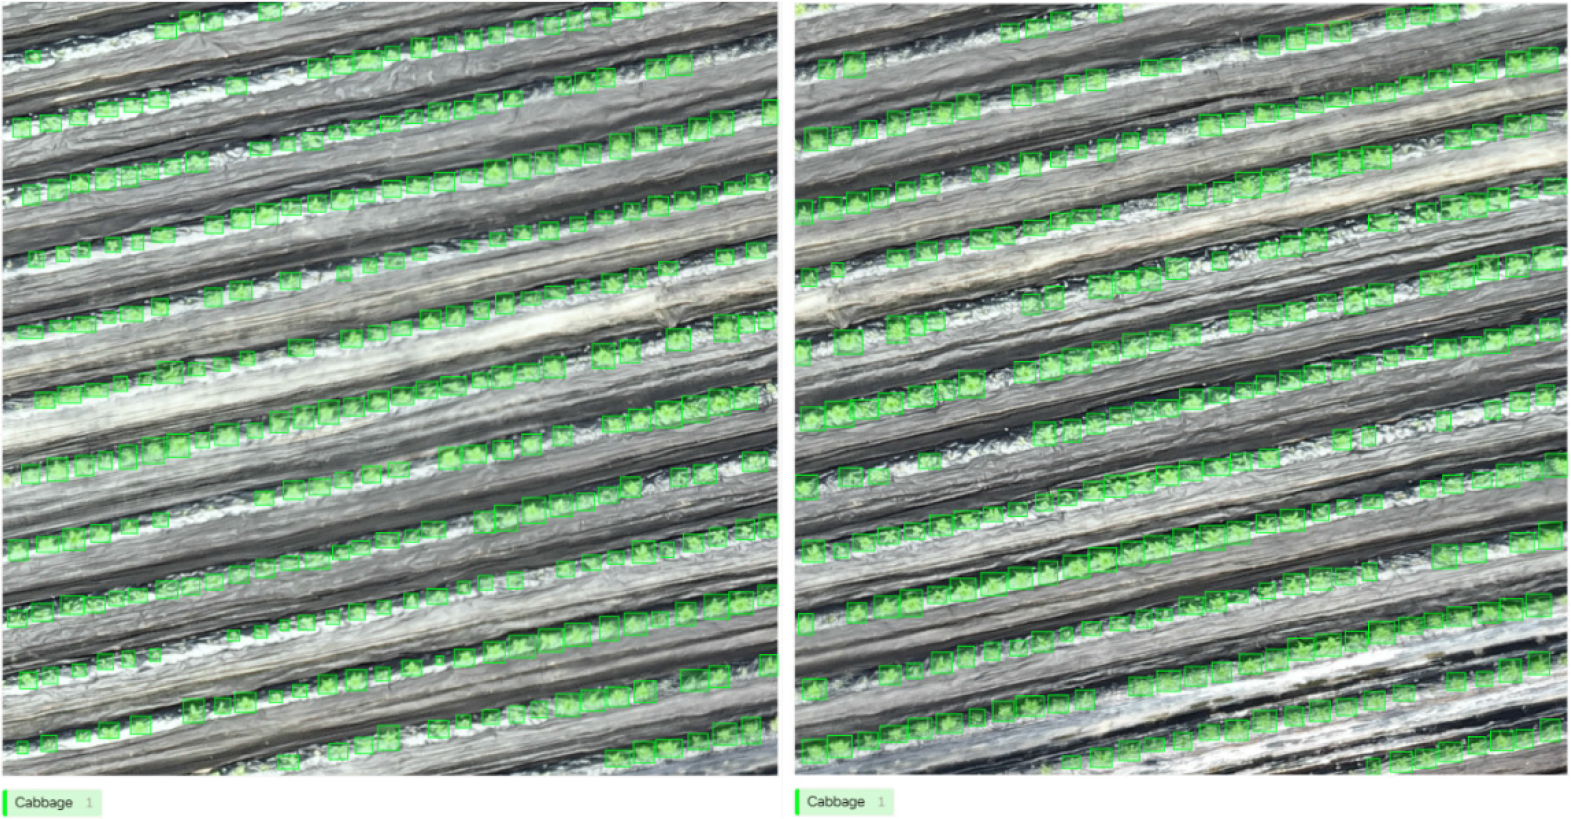
A Faster R-CNN object detection model, employing a ResNet-50 FPN backbone (Fig. 3), was trained using the PyTorch framework to detect individual cabbage plants within preprocessed UAV RGB imagery. The high-resolution orthomosaic, generated from images acquired two weeks post-transplanting, was divided into 512 × 512-pixel tiles with a 20% overlap and resized to 224 × 224 pixels. The trained model achieved an F1-score of 0.90 on the test set, using a confidence score threshold of 0.7. This demonstrates high accuracy in early-stage cabbage plant detection.
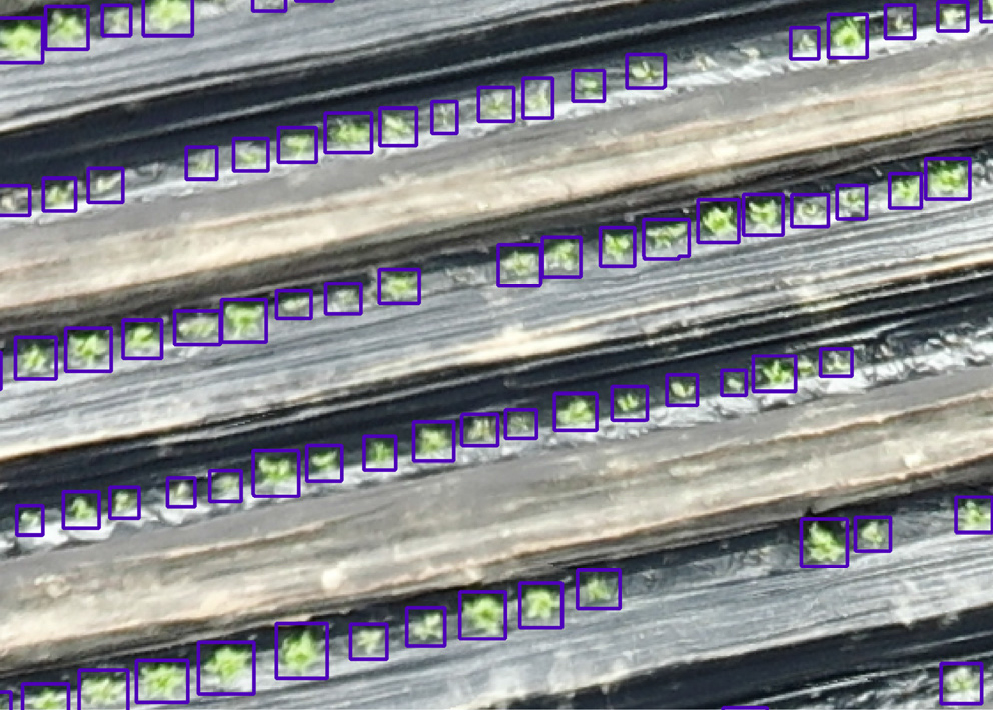
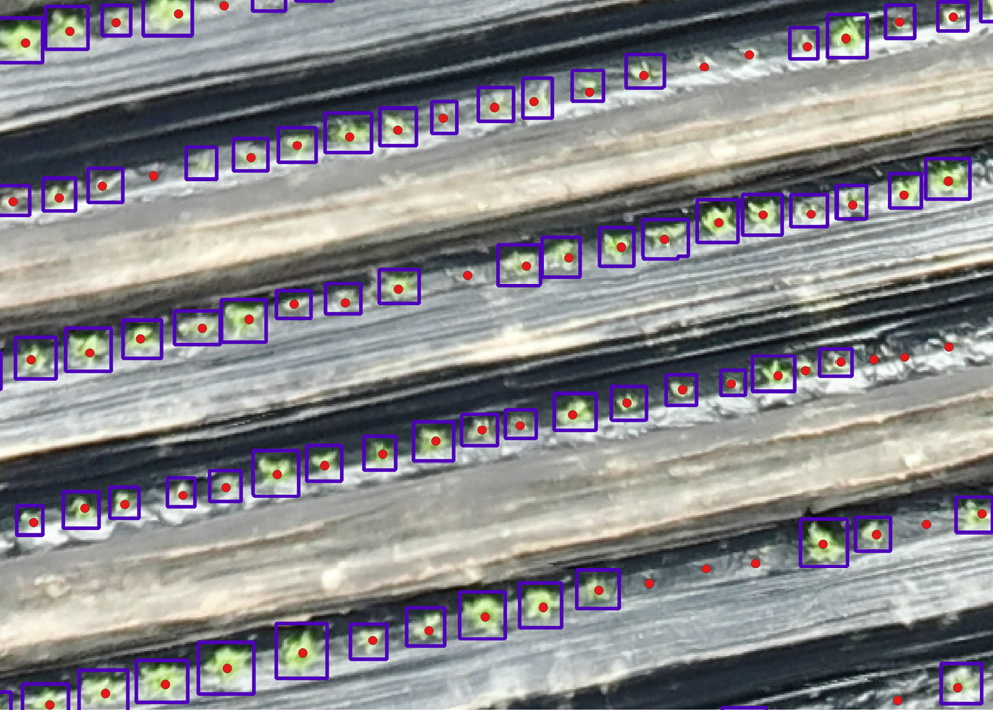
Fig. 4 illustrates the manually annotated ground truth data, showing labeled cabbage plants with bounding boxes used for model training. Two adjacent orthomosaic image tiles (512 × 512 pixels) from the UAV dataset, showing detected cabbage plants outlined with green bounding boxes labeling. Fig. 5 visualizes the predicted bounding boxes, further confirming the model’s ability to generalize to unseen data. These results underscore the model capability to identify the majority of healthy cabbage plants at this crucial early growth stage, providing a foundation for assessing plant vigor and identifying missing plants.
Identification of missing plants and planting map generation
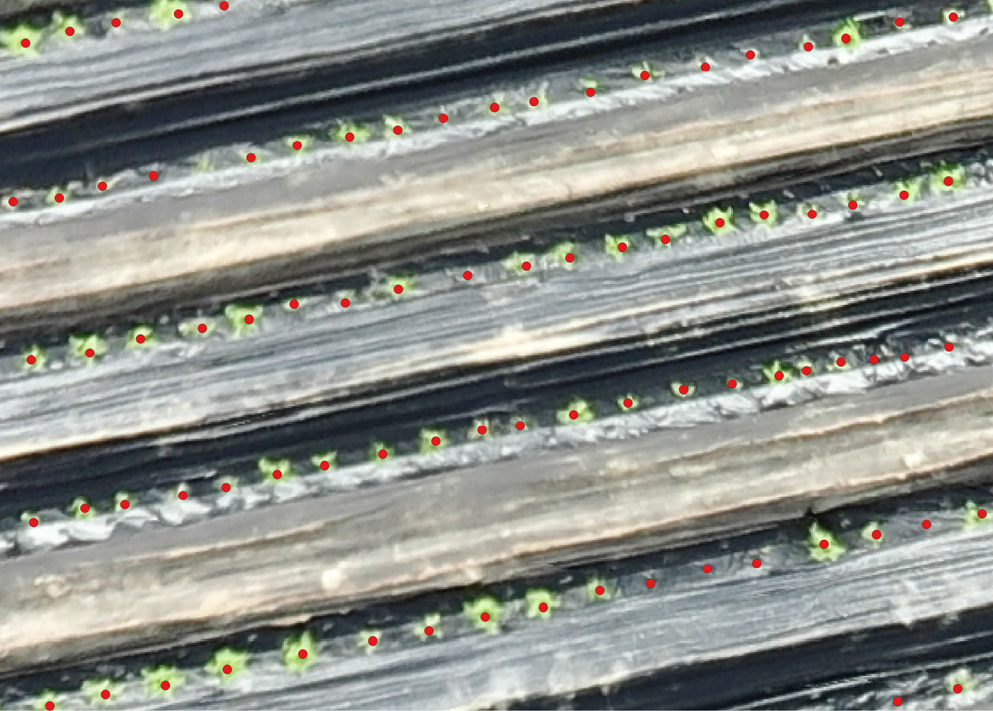
To identify potentially missing plants, a grid of 7,103 expected planting locations was generated based on the known field planting pattern (Fig. 6). A comparison of these expected locations with the model bounding box predictions (Fig. 5), refined by removing overlapping initial planting positions (Fig. 7), revealed a MPR of 54.81%, with 3,893 plants classified as missing out of 7,103 expected. This high MPR highlights the challenges in achieving uniform stand establishment and emphasizes the importance of early detection to enable timely replanting. The spatial distribution of these potentially missing plants is visualized in Fig. 7, where red points indicate locations where a plant was expected but not detected.
The mean value derived from the model training process was calculated for each detected plant to detect plants with low vigor. Plants with a mean value of less than 0.05 were determined to be potentially less vigorous.
Effectiveness of area-based classification for plant vigor assessment
The area-based classification method, utilizing bounding box area as a proxy for plant size, successfully differentiated between low-vigor and healthy cabbage plants. As shown in Table 1, plants classified as low-vigor exhibited a mean bounding box area of 0.0309 m2, significantly smaller than the 0.0563 m2 mean area observed for healthy plants (Fig. 8). A two-sample t-test confirmed that this difference in mean area is statistically significant (p < 0.001).
Table 1.
Detailed area statistics by plant status.
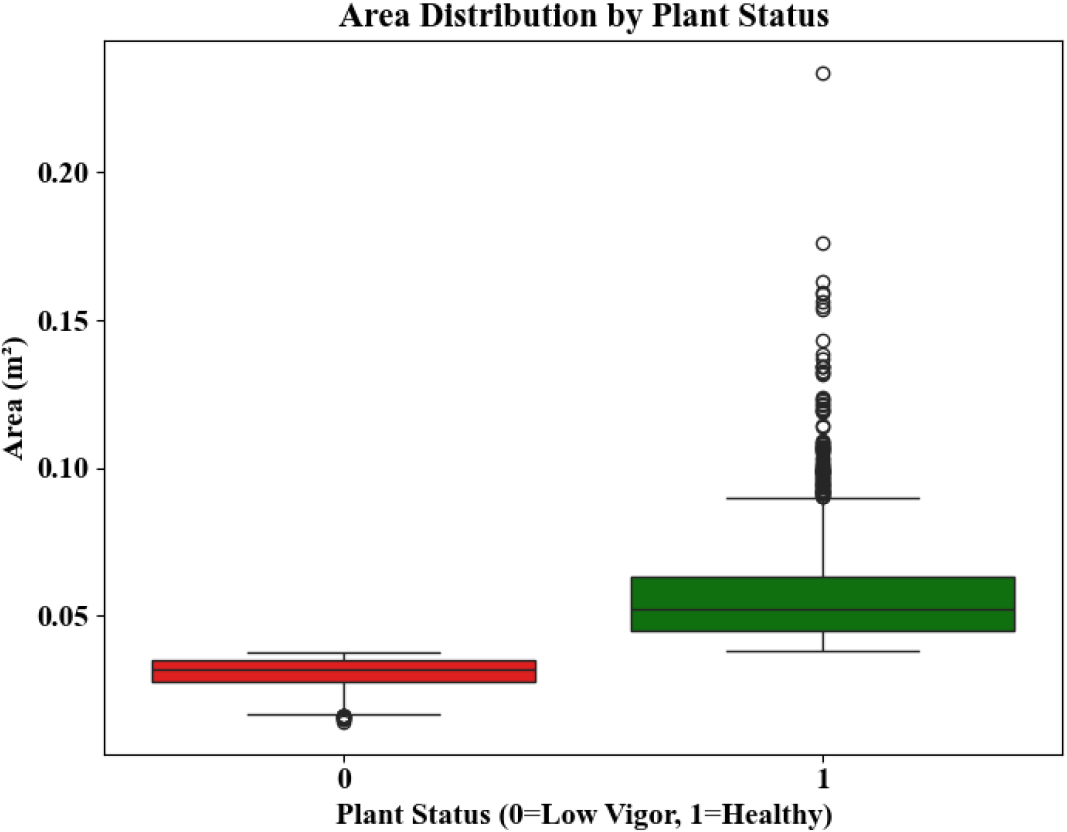
The histogram (Fig. 9) displays the frequency distribution of bounding box areas (in square meters) for all detected cabbage plants. The red dashed line represents the mean bounding box area, while the blue dashed line indicates the 30th percentile threshold used to classify plants as “low-vigor” (areas below the threshold) or “healthy” (areas at or above the threshold). This difference is further illustrated by the distinct distributions in Fig. 8, where the interquartile ranges of the two groups do not overlap.
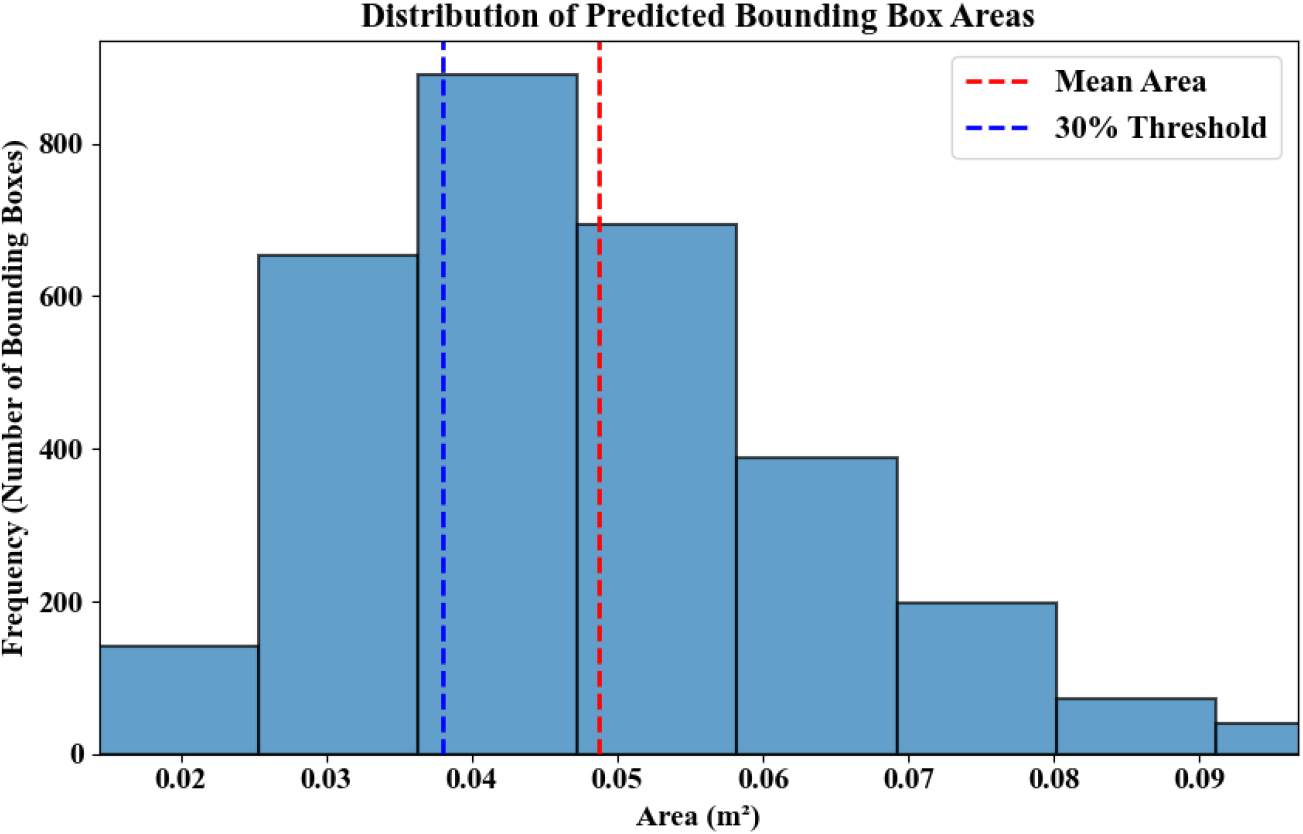
The 30th percentile of the overall area distribution served as an effective threshold, classifying 937 plants (13.19%) as low-vigor and 2,185 (30.76%) as healthy. This method reliance on readily available bounding box data provides a computationally efficient and easily interpretable approach to vigor assessment. The distinct area distributions, detailed in Table 1, offer a comprehensive understanding of plant vigor. Moreover, this approach simplicity allows for integration into practical decision support systems, facilitating timely interventions for improved stand establishment. These results underscore the potential of combining UAV imagery with deep learning for rapid and quantitative plant vigor assessment in precision agriculture.
These findings align with the general principle that larger plants, especially during early growth stages, are typically more vigorous and better established (Poorter and Remkes, 1990; Poorter et al., 2009). The visual representation of this classification, using color-coded points in Fig. 7 and bounding boxes in Fig. 10, provides an intuitive understanding of the spatial distribution of plant vigor across the field. This area-based approach offers a practical and efficient means of assessing plant vigor, complementing the identification of missing plants to provide a more complete picture of stand establishment success.
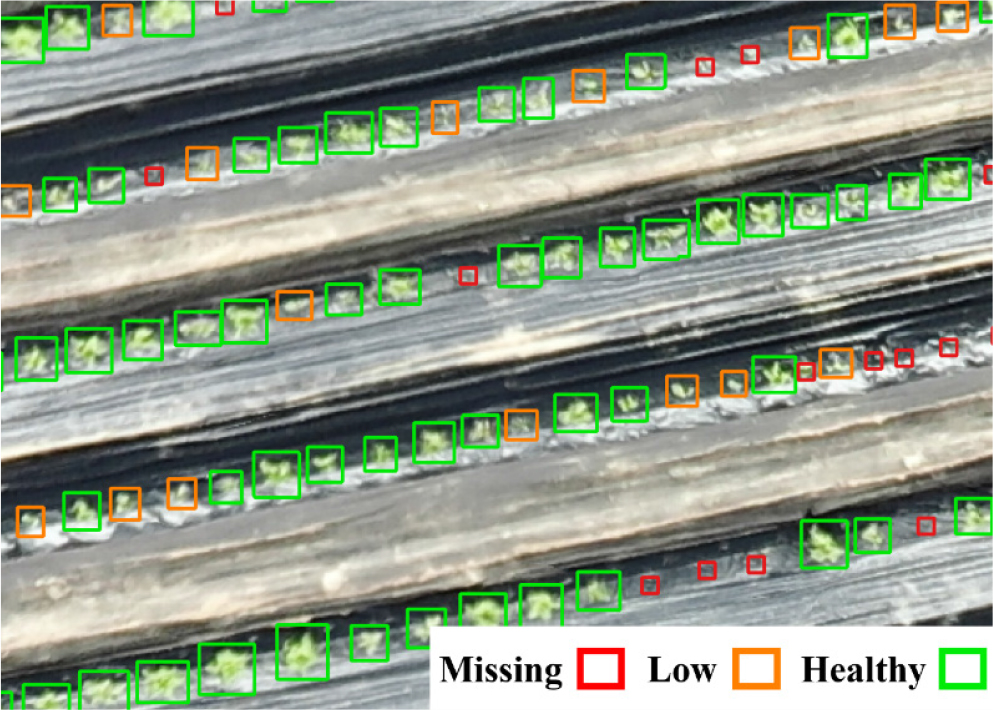
Fig. 10.
Visualization of cabbage plant status classification. An orthomosaic image tile from the unmanned aerial vehicle (UAV) dataset. The same tile with overlaid bounding boxes representing the classification results: green for “healthy” plants, orange for “low-vigor” plants, and red dots indicate locations where plants are classified as “missing” based on comparison with expected planting position.
Visualization and spatial analysis
Visual representation of detection results, as exemplified in Fig. 10, offers a valuable tool for understanding the spatial distribution of missing and low-vigor cabbage plants. The color-coded bounding boxes overlaid on the orthomosaic tiles—red dots for missing, orange for low-vigor, and green for healthy—provide an immediate, intuitive assessment of stand establishment across the field. The classification is based on the Faster R-CNN detection results, bounding box area, and comparison with expected planting positions. This visualization provides the basis for generating a targeted replanting map. This visualization allows for the rapid identification of problem areas, facilitating targeted interventions.
Furthermore, spatial analysis, based on comparing detected plant locations (Fig. 7) with the expected planting grid (Fig. 6) and refining those positions by removing overlaps with predicted bounding boxes, enables precise localization of missing plants. The resulting spatial data, summarized in Table 2, quantifies the extent of the issue, revealing a 54.81% MPR. Integrating these visualizations and spatial data into a geo-referenced replanting map provides actionable information to guide supplementary planting efforts. The ability to visualize the spatial distribution of plant status, combined with quantitative data on MPRs and area-based vigor assessment, empowers data-driven decisions regarding replanting and resource allocation. Consequently, this approach represents a significant advancement over traditional manual scouting methods, enabling more efficient and precise management of crop stand establishment. For example, the concentration of red and orange boxes in certain areas, as seen in Fig. 10, could indicate localized issues with soil conditions, irrigation, or pest pressure, prompting targeted investigation and remediation.
Table 2.
Grouped statistics by status (missing, low vigor, healthy).
| Status | Count | Status ratio (%) |
| Missing plants | 3,893 | 54.81 |
| Low Vigor (0) | 937 | 13.19 |
| Healthy (1) | 2,185 | 30.76 |
| Overlapping instances | 88 | 1.24 |
| Total | 7,103 | 100.00 |
Management practices and their impact on stand establishment
The substantial MPR (54.81%) and the considerable proportion of low-vigor plants (13.19%) observed in the Galeup-ri Demonstration Complex, as quantified in Table 2, underscore significant challenges to uniform stand establishment. These results likely reflect the “not well-managed” condition of the cabbage cultivation area, as noted in the site description. Inconsistent management practices, such as variations in planting depth, soil compaction, and uneven irrigation, may have contributed to increased plant mortality and reduced vigor. The irregular planting patterns observed in the field could further exacerbate these issues. For example, the spatial distribution of missing and low-vigor plants visualized in Fig. 10, particularly the clustering of red dots and orange bounding boxes, suggests localized problems potentially related to inadequate soil preparation, water availability, or pest and disease pressure. These findings emphasize the critical role of consistent and precise management practices, particularly during the early growth stages, in achieving optimal stand establishment (Piao et al., 2022). The developed system provides a valuable tool for identifying specific areas that require attention, thereby enabling targeted interventions to improve management practices and ultimately minimize yield loss.
Limitations and future directions
While the proposed system demonstrates promising results for early detection of missing and low-vigor cabbage plants, certain limitations warrant consideration. The accuracy of the area-based vigor assessment relies heavily on the precision of the bounding box predictions. Overlapping plants or variations in plant morphology could introduce errors in area estimation. Additionally, the simplified image analysis approach, while computationally efficient, may be sensitive to variations in lighting conditions and image quality. Furthermore, the relatively small dataset size (91 training images) is a limitation, although data augmentation techniques were employed to mitigate this.
Future research should focus on refining the detection and classification algorithms to improve robustness and accuracy. Exploring instance segmentation models could address the issue of overlapping plants, enabling more precise area estimation. Integrating multispectral or hyperspectral data could provide richer information for vigor assessment, potentially allowing for a more nuanced classification beyond the binary “low-vigor” and “healthy” categories (Sethy et al., 2022). This could also allow for the detection of specific nutrient deficiencies or disease stresses.
Furthermore, incorporating a more sophisticated analysis of spatial patterns, beyond simple density, could provide deeper insights into the underlying causes of poor stand establishment (Zhang et al., 2019). Automating the generation of expected planting locations from image data would further enhance the system efficiency and scalability. Future work will also involve expanding the dataset to include images from different fields, growing conditions, and cabbage varieties to improve the model robustness and generalizability.
Finally, validating the system across diverse field conditions, cabbage cultivars, and growth stages would strengthen its generalizability. It would also be beneficial to explore the integration of this UAV-based system with other data sources, such as soil sensors and weather data, to provide a more holistic understanding of crop performance. Assessing the economic feasibility and cost-benefit ratio (cost of UAV and software versus potential yield increase) would further strengthen the practical implications of this research.
Conclusion
This study demonstrates the successful application of UAV-acquired RGB imagery and a streamlined image analysis pipeline for the early detection of missing and low-vigor cabbage plants. The pipeline employs a Faster R-CNN model with a ResNet-50 FPN backbone, achieving a high F1-score of 0.90 on the test dataset, indicating accurate identification of individual cabbage plants within a complex field environment. A novel, simplified area-based classification method, using the 30th percentile of predicted bounding box area as a threshold, provides a computationally efficient means of assessing plant vigor and complements traditional detection metrics. The results highlight significant challenges to uniform stand establishment in the study area, revealing a MPR of 54.81% and classifying 13.19% of detected plants as low-vigor. The developed system offers a marked improvement over traditional manual scouting methods by enabling rapid and spatially precise assessment of plant status. Visualizations, particularly the overlaid bounding boxes (Fig. 10) and the planting map (Fig. 7), provide intuitive and actionable information to guide replanting efforts and targeted interventions. This research underscores the potential of UAV technology, coupled with deep learning and simplified image analysis, to enhance the efficiency and precision of crop management practices during the critical early stages of growth. The system, validated through rigorous testing, achieved notable precision in identifying cabbage plants. Future work will focus on refining the vigor assessment methodology, validating the system under diverse field conditions, exploring its integration with automated replanting systems, and investigating the use of instance segmentation to improve the accuracy of plant counting and area estimation. This research contributes to the growing body of knowledge on UAV-based crop monitoring, offering a novel and practical solution for improving stand establishment and ultimately contributing to more sustainable and resilient agricultural systems.
