

Introduction
Materials and Methods
Experimental site and setup
Growth parameter and chlorophyll measurement
Soluble sugar and starch determination
Aboveground biomass, grain yield and harvest index
Nitrogen use efficiency assessment
Statistical analysis
Results and Discussion
Growth parameters under the combination of different biochar levels and nitrogen-based fertilizers
Chlorophyll and grain soluble carbohydrate under the combination of different biochar levels and nitrogen-based fertilizers
Aboveground biomass, grain yield and harvest index under the combination of different biochar levels and nitrogen-based fertilizers
Evaluation of nitrogen use efficiency under the combination of different biochar levels and nitrogen-based fertilizers
Principal component analysis
Conclusion
Introduction
Nitrogen forms part as one the key component in cellular metabolisms and it essential for crop growth and development. But the excessive use of nitrogen-based fertilizers can lead to environmental pollution and decrease crop utilization (Kim et al., 2025). The use of urea and slow-release fertilizer is increasing as it is essential over other form of N-fertilizer in terms of economic advantages (Biswas and Ma, 2016). Similarly, urea is accepted as an N-fertilizer and is used by a lot of corn production systems while other sources of N-fertilizers (slow releasing fertilizer [SRF], urea, ammonium nitrate etc.) are gaining popularity over the years (Bandel et al., 1980).
The use of nitrogen-based fertilizer affects corn dry biomass production by affecting the leaf area, photosynthetic capacity and eventually affecting yield, grain, and chlorophyll (Muchow and Sinclair, 1994). Biochar’s effectiveness as a soil amendment is largely due to its porous structure and large surface area, which enhance nutrient retention and minimize leaching losses. This improved nutrient availability supports higher crop uptake and yield. In addition, biochar contributes to environmental benefits by reducing greenhouse gas emission and immobilizing heavy metals and organic contaminants (Hannet et al., 2021). The combined use of biochar and nitrogen-based fertilizer is a way to sustainable agriculture and improve soil quality, texture, fertility, plant uptake and crop yield (Abdulraheem et al., 2023). The type of thermochemical process, the type of feed stock used, makes up the characteristics of biochar such as the physical, chemical and biological properties. The improvement in NUE in cereals crops is a big challenge in production because a large amount of N-based fertilizer is required to maximize yield (Zhang et al., 1993; Biswas and Ma, 2016). The grain yield and NUE of corn plant is dependent on the assimilation of nitrogen and carbon dioxide (CO2) (Sinclair and Horie, 1989; Muchow and Sinclair, 1994). The rate or level of biochar and N-fertilizer applied can affect grain NUE, corn yield, and corn quality. A study conducted by (Tang et al., 2023) using biochar in combination of fertilizer shows that the yield of corn increased by 26.7% and biochar enhanced the NUE by 18.6 - 39.2% of corn. In addition, Wang et al. (2023) conducted a study on the combination of biochar and N-fertilizer on soil nitrogen, water dynamics on corn. It was concluded that corn yield and fertilizer nutrient use efficiency improved by 4.9 - 11.4% and 38.7 - 50.3 kg·kg-1 respectively compared with no biochar applied treatment. A lot of research is underway to improve crop production and enhance the use of nitrogen in several ways, but the two main ways are by breeding new varieties of maize with high NUE and by improving fertilizer application management. To improve NUE is important to ensure sustainable agriculture and environmental conservation. Therefore, this study focused on understanding the combined effect of biochar and nitrogen-based fertilizer on NUE and physiological properties of corn. Particular attention was given to how these combined treatments influenced the yield parameters (aboveground biomass, grain yield, and harvest index), chlorophyll, soluble sugar and starch content. The outcome of this study may be valuable in the development of new and improved biochar in combination with N-fertilizers management practice to increase yield and NUE in the greenhouse during the winter season.
Materials and Methods
Experimental site and setup
The greenhouse experiment was conducted from September 2024 to February 2025 at Chungbuk National University, Department of Agronomy located in Cheongju, Korea (36°37′48.1″N 127°27′05.4″E). The commercial biochar was made from Wood Charcoal and Peat with the main ingredient as Palm Charcoal 97 Peat 3 from Nouveau Co., Ltd., Korea. The nitrogen-based fertilizer (SRF) was brought from a local agricultural store with the brand name “NongHyub, Sry-chobi brand”. Biochar (200 kg·10a-1) was mixed uniformly into the soil in the pot before transplanting. Biochar application rates were 0% (B0), 100% (B1), and 200% (B2). Fertilizer was applied based on Rural Development Administration (RDA), Korea standard guidelines. Nitrogen was supplied as urea (15.8 kg·10a-1), Slow-releasing fertilizer (9 kg·10a-1) (Table 1). In addition, Phosphorus (3 kg·10a-1) and Potassium (6.3 kg·10a-1) were applied at standard rates. Urea application was split into 50% at transplanting and 50% at 6 - 8 leaf stage before tasseling. Two corn varieties, Mibaek#2 and Taeyangchal, were used. Seeds were first germinated in horticultural soil for 21 days until reaching the 2 - 4 leaf stage, after which seedlings were transplanted into 1/5,000 a pots filled with sandy loamy soil. The soil was characterized both before and after the experiment (Table 2). Greenhouse temperature was monitored throughout the season with thermometer (Fig. 1). Water was applied in the morning and evening throughout the experiment. Each treatment was arranged with four replicates. Data were taken 100 and 121 days after transplanting (DAT).
Table 1.
Description of treatment levels.
| Biochar | Nitrogen-based fertilizer | Combination |
| 0% biochar (B0) | Urea (F1) | B0F1 |
| SRF (F2) | B0F2 | |
| 100% biochar (B1) | Urea (F1) | B1F1 |
| SRF (F2) | B1F2 | |
| 200% biochar (B2) | Urea (F1) | B2F1 |
| SRF (F2) | B2F2 |
Table 2.
Soil chemical properties before (transplanting) and after harvest.
| Treatment | TC content (%) | SOM (g·kg-1) | pH (1 : 5, H2O) | EC (dS·m-1) | |
| Before | 0.2 ± 0.05 | 3.8 ± 0.9 | 5.5 ± 0.05b | 0.10 ± 0.00d | |
| Afterz | B0F1 | 0.1 ± 0.04 | 2.4 ± 0.8 | 5.5 ± 0.01b | 0.15 ± 0.00c |
| B0F2 | 0.1 ± 0.10 | 2.9 ± 1.8 | 5.4 ± 0.03cd | 0.16 ± 0.00b | |
| B1F1 | 0.1 ± 0.00 | 2.7 ± 0.0 | 5.3 ± 0.01d | 0.19 ± 0.00a | |
| B1F2 | 0.1 ± 0.03 | 3.3 ± 0.5 | 5.4 ± 0.04cd | 0.10 ± 0.00d | |
| B2F1 | 0.2 ± 0.07 | 4.3 ± 1.4 | 5.7 ± 0.01a | 0.10 ± 0.00d | |
| B2F2 | 0.2 ± 0.04 | 4.1 ± 0.8 | 5.4 ± 0.03cd | 0.10 ± 0.00d | |
| ANOVA | f-value | ns | ns | *** | *** |
Mean difference of sample size (n = 3) between treatment was employment with Tukey’s test, and paired T-test was used for the different difference between treatment and varieties.

Growth parameter and chlorophyll measurement
Plant height, number of cob and leaves, fresh and dry weight of corn plant were measured at DAT 100. Chlorophyll contents were measured at DAT 100 in uppermost fully expended corn leaves (Arnon, 1949; Kotecha and Ram, 2023). 0.5 g of fresh corn leaves were cut into 0.5 cm length and immersed in 25 mL of 80% (w/v) acetone. The mixture was vortexed and incubated for 24 h at 4℃ darkness. The supernatant was extracted and an absorbance was measured at 645 nm (Chlorophyll b) and 663 nm (Chlorophyll a) using 80% acetone in two plastic cuvettes as blank sample using spectrophotometer (UV-1900i, Shimadzu, Japan). Total Chlorophyll concentration was calculated using Eqs. (1), (2), (3).
where, FW : fresh weight
D : optical density (absorbance)
DF : dilution factor, calculated as V / (1,000 × W)
V : final volume of chlorophyll extract in 80% acetone
W : fresh weight of tissue extracted
Soluble sugar and starch determination
Measurement of soluble sugar and starch provides a relevant insight into plant carbon allocation and energy storage in plant which is relevant in the evaluating physiological responses. At DAT 100, soluble carbohydrate was measured in grains using the phenolic-sulfuric acid method (Simla et al., 2010; Harakotr et al., 2022). Dried grain powdered sample (0.1 g) were placed into a 15 mL falcon tube, followed by the addition of 5 mL of 80% ethanol. It was incubated in water bath for 30 mins at 85℃. After incubation, the sample were centrifugated at 4,000 rpm for 5 mins at 4℃ to obtain the soluble sugar. For starch determination, the residual pellet was first dried in an oven for 1 hour, then 2 mL of DW was added and vortexed. The tubes were boiled for 125 mins at 99℃ and cooled immediately in ice. To this, 2 mL of 9.3 of 9.3 N HCLO4 was added, and the solution was shaken at 200 rpm for 15 mins. Afterward, 4 mL of DW was added and centrifugated at 4,000 rpm for 10 mins. The resulting supernatant was transferred to a 50 mL volumetric tube. The extraction step was repeated by adding 2 mL of 4.6 N HCLO4 to the residual, shaked and followed the steps as previously. The concentrations of sugar and starch were quantified at 630 nm using a UV spectrophotometer (UV-1900i, Shimadzu, Japan). Results were expressed as milligrams per gram dry weight (mg·g-1, DW), with glucose used as the standard (Han et al., 2020; Kim et al., 2025).
Aboveground biomass, grain yield and harvest index
At harvest (DAT 121), the aboveground biomass (leave, shoot and cob), grain yield and harvest index were determined. Four plants were taken per treatment, they were separated into leaves, shoot, cob, and grain. It was then oven dried at 80℃ to constant weight for the determination of aboveground biomass, grain yield, harvest index (HI). These were expressed in gram per pot (g·pot-1) and percent (%).
Nitrogen use efficiency assessment
During the evaluation of plant nitrogen content at DAT 121, we considered the leaves, shoot and grain of the plant at the physiological maturity stage (3 replications from each treatment). The samples were dried at 80℃ to constant weight for 48 h. The sample were grinded into powder, 0.3 g were weighed on a precision scale (Model PAG213C, OHAUS Corp., USA). Total nitrogen was analysed with an N analysis (Rapid MAX N exceed, Elementar Americas, USA) using Dumas’s method (Etheridge et al., 1998; Xu et al., 2012; Galindo et al., 2021). The NUE was calculated using the factors of supplied of nitrogen, dry weight of shoot and grain, nitrogen uptake and yield. NUEs were calculated by using Eqs. (4), (5), (6), (7), (8).
Statistical analysis
Statistical analysis was performed using R statistical software (R Core Team, 2020) and RStudio (RStudio Team, 2020). Principal component analysis (PCA) was performed to visualize the relations among nitrogen use efficiency indices and biochar treatments (Jolliffe and Cadima, 2016). Data were compared using analysis of variance (ANOVA) followed by Tukey’s honestly significant difference (HSD) test. Paired T-test was used to compare difference between varieties and treatment, with significant differences indicated by different letters by Tukey’s HSD test at p < 0.05.
Results and Discussion
Growth parameters under the combination of different biochar levels and nitrogen-based fertilizers
In this experiment, we investigated the effect of different biochar level (0, 100, and 200%) and nitrogen-based fertilizer (urea, SRF) on the growth of two corn varieties: Mibaek#2 and Taeyangchal. The plant height showed a significant variation influence by treatment (p = 0.044) at DAT 100. However, 200% biochar with urea (B2F1) increased significantly by 32.6% and 21.05% compared to 0% biochar with SRF (B0F2), at DAT 100 for Mibaek#2 (Fig. 2A). The grain dry weight of B2F1 was 246% and 152.24% higher than B0F2 and 100% biochar with urea (B1F1) in Mibaek#2 and Taeyangchal respectively. The combination of biochar and nitrogen-based fertilizer especially B2F1 (p ≤ 0.01) enhanced the dry weights in both Mibaek#2 and Taeyangchal variety at DAT 100 (Fig. 2B - D). Supporting a meta-analysis finding that, biochar combined with nitrogen-based fertilizer can substantially improve crop growth and productivity by increasing dry weight, which highlights its broad impact on growth parameters (Martínez-Gómez et al., 2022; Li et al., 2023; Rani and Garg, 2025). These findings suggest B2F1 is grounded in the synergy between improved soil environment (biochar) and enhanced nitrogen availability (urea). This promotes stronger vegetative growth and biomass accumulation which is assessed through dry weight. Furthermore, the variation in variety response underscores the importance of targeted nutrient management based on genotypic characteristics to maximize the benefits of biochar-based fertilization strategies and also suggests that biochar can improve the efficiency of nitrogen use for increase grain yield.
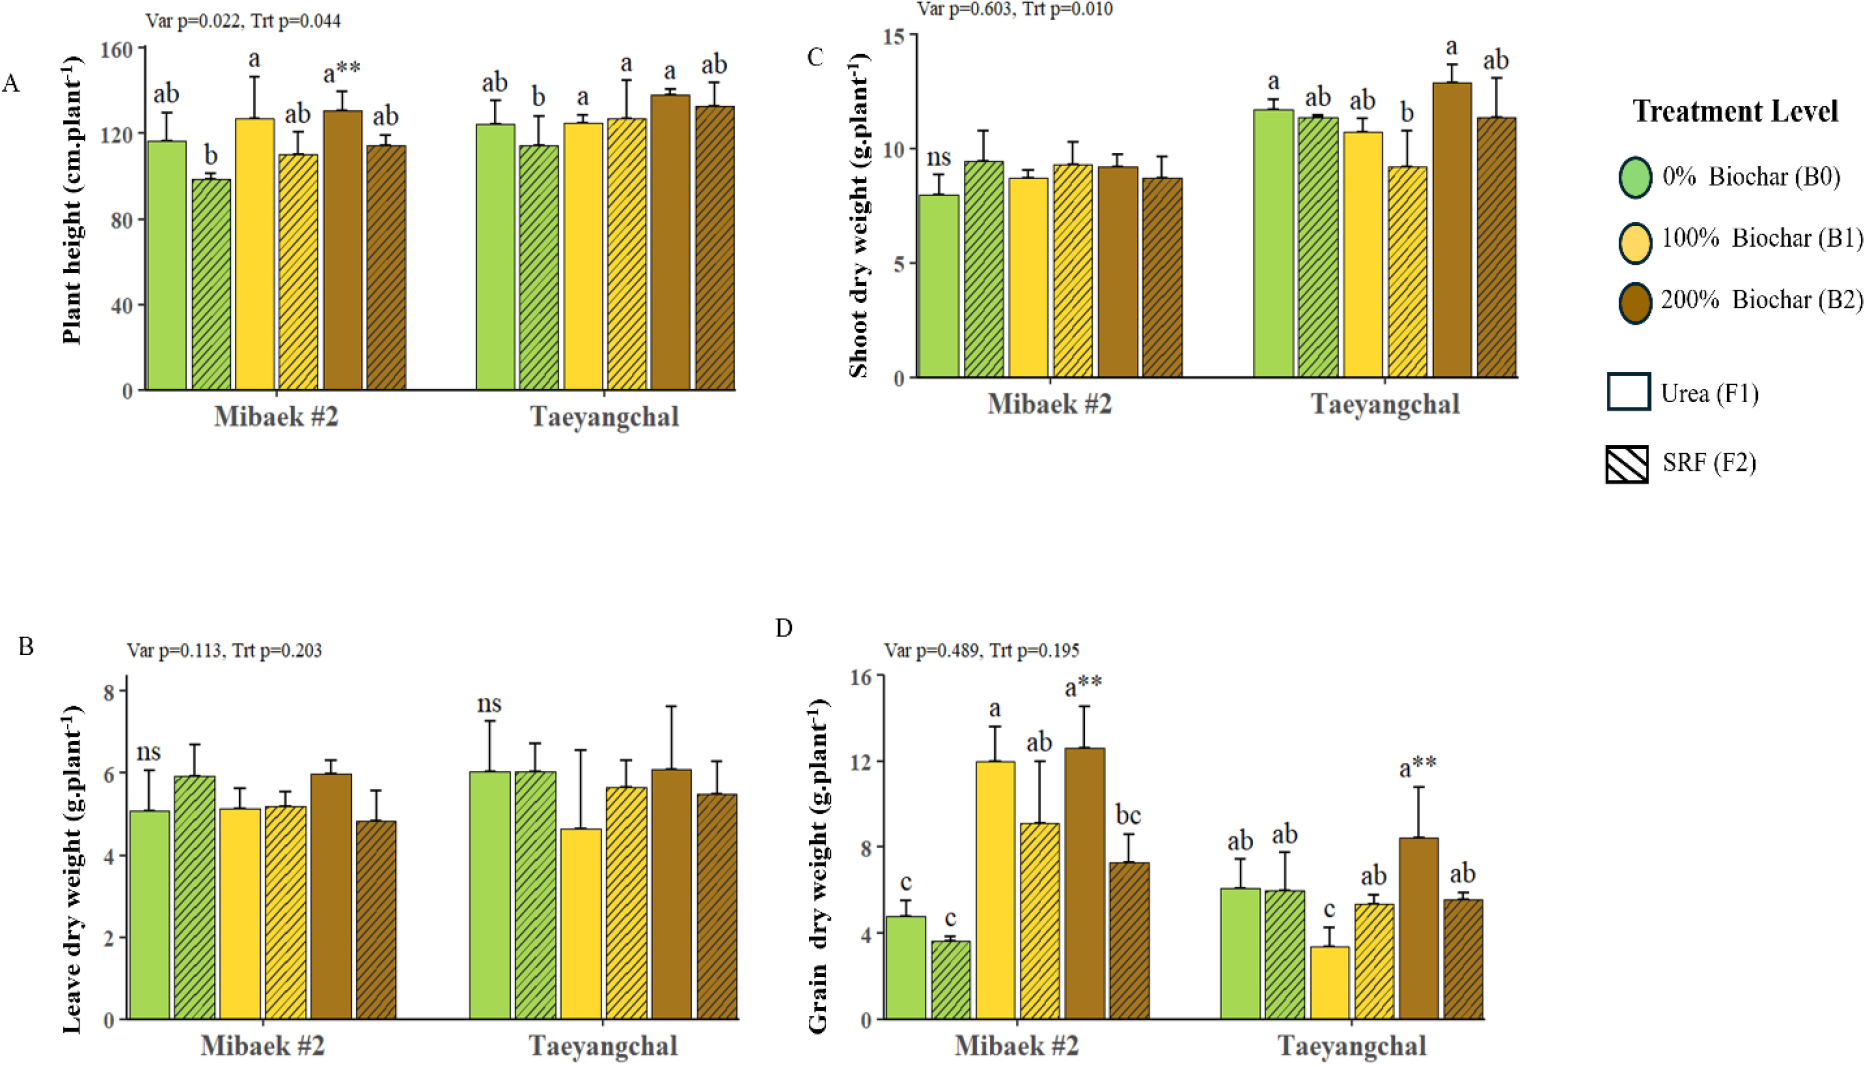
Fig. 2.
Effect of biochar in combination with nitrogen-based fertilizers (urea, slow releasing fertilizer [SRF]) at 100 days after transplanting (DAT). Mean difference between treatment was employed with Tukey’s test, and paired T-test was used for the difference between treatment (Trt) and varieties (Var). a - c: Different letters indicate significant differences at p < 0.05. ** indicates significance at p < 0.01; ns, not significant.
Chlorophyll and grain soluble carbohydrate under the combination of different biochar levels and nitrogen-based fertilizers
At DAT 100, the significant treatment effect (p < 0.05) was observed for chlorophyll content concentration, under B2F1 recording the highest value. B2F1 appeared to have a 75.68% higher chlorophyll content compared with 200% biochar with SRF (B2F2) (Fig. 3A). This indicates that biochar with urea synergy enhances nitrogen uptake and photosynthetic activity more effectively than biochar combined with slow-release fertilizer. Similar improvements in chlorophyll content due to biochar and nitrogen interaction have been reported in wheat and maize, where enhanced soil N retention supported greater leaf greenness and photosynthetic efficiency (Allohverdi et al., 2021; Zhao and Zhang, 2021; Duan et al., 2024). Carbohydrate content accumulation also followed a similar pathway. Under 100% biochar with SRF (B1F2), starch content increased by 90 - 561% compared to B1F1 and B2F1 (Fig. 3C). Although total starch and sugar content did differ significantly among treatments, biochar consistently promoted greater starch accumulation under Mibaek#2. This emphasize that biochar enhances soil nutrient cycling and starch-related gene expression, responsible for the accumulation of starch in cereals crops like rice (Gong et al., 2020; Martínez-Gómez et al., 2022).
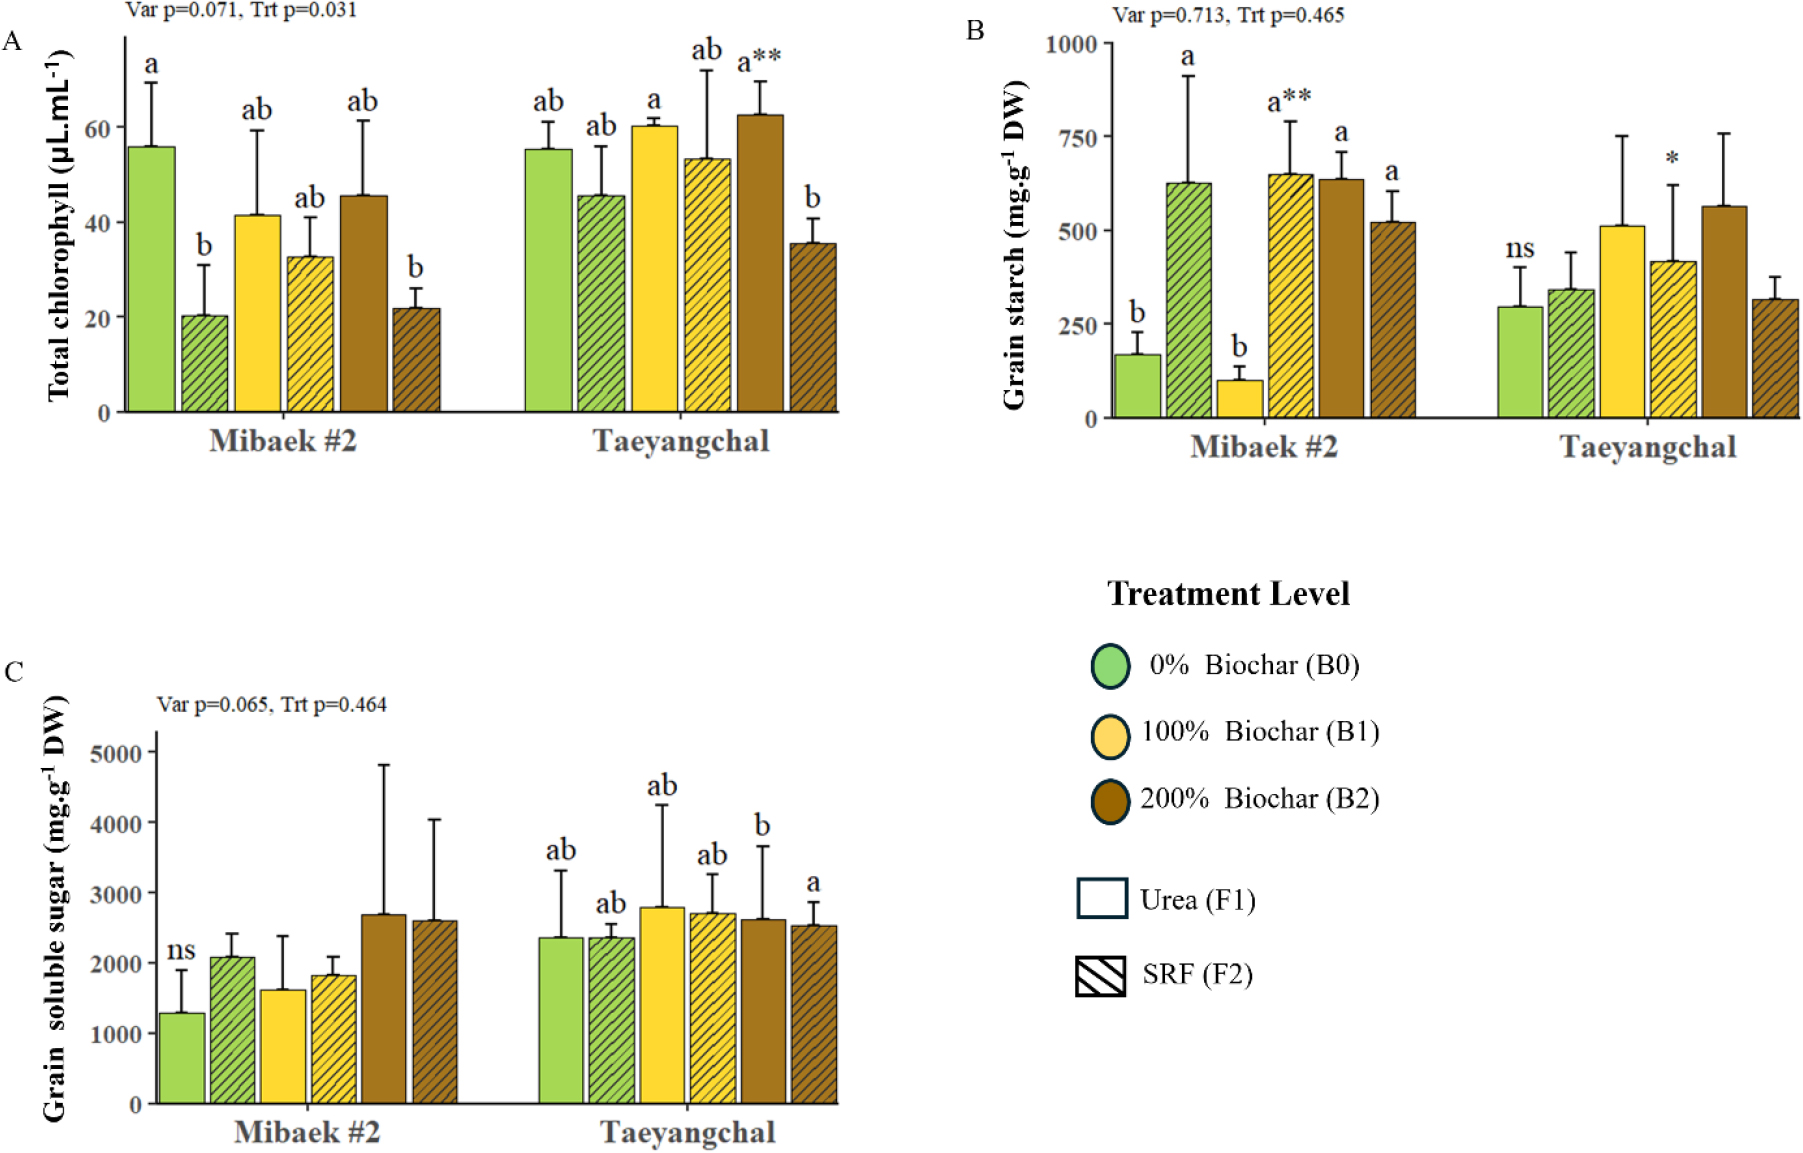
Fig. 3.
Effect of biochar in combination with nitrogen-based fertilizers (urea, slow releasing fertilizer [SRF]) at 100 days after transplanting (DAT). Mean difference between treatment (Trt) and variety (Var) was employed with Tukey’s test, and paired T-test was used for the different difference between treatment and varieties. a, b: Different letters indicate significant differences at p < 0.05. * and ** indicate significance at p < 0.05 and p < 0.01, respectively; ns, not significant.
Aboveground biomass, grain yield and harvest index under the combination of different biochar levels and nitrogen-based fertilizers
At DAT 121, the combined application of biochar and nitrogen fertilizer significantly increased aboveground biomass, grain yield and harvest index in corn. The treatment B2F1 give the highest response, with aboveground biomass, grain yield and harvest index increasing by 43.2%, 154.84% (p = 0.044), 88.38% (p = 0.037) respectively, compared with the unfertilized biochar control (0% biochar with urea, [B0F1]). Similarly, B1F1 also showed an enhanced grain yield (15.925 g·pot-1), harvest index (56.21%) (Table 3), confirming that the synergistic effect of biochar and nitrogen fertilizer improved biomass towards grain production. These results are consistent with earlier findings (Yeboah et al., 2016; Badu et al., 2019; El-Sobky and Abdo, 2021). Varietal responses to the treatment showed some differences. Mibaek#2 showed a stronger and more consistent improvement under biochar and fertilizer combinations, specially under B2F1, where all measured parameters were significantly higher (p < 0.05). In contrast, Taeyangchal exhibited relatively stable performance with no significant difference in biomass, grain yield or harvest index (p > 0.45). In conclusion, these results suggest that biochar, particularly at higher application rates combined with nitrogen fertilizer, can enhance yield components and efficiency parameters response.
Table 3.
Effect of biochar in combination with nitrogen-based fertilizers (urea, slow releasing fertilizer [SRF]) on aboveground biomass (g·pot-1), grain yield (g·pot-1), and harvest index (%) at 121 days after transplanting (DAT).
| Variety | Treatmentz |
Aboveground biomass (g·plant-1) |
Grain yield (g·plant-1) |
Harvest index (%) |
| Mibaek #2 | B0F1 | 2.15 ± 1.5ab | 11.75 ± 2.4ab | 54.37 ± 7.89ab |
| B0F2 | 17.25 ± 4.5b | 6.42 ± 3.7b | 34.95 ± 15.51b | |
| B1F1 | 27.30 ± 6.4a | 15.92 ± 6.2a | 56.21 ± 13.22ab | |
| B1F2 | 21.37 ± 3.5ab | 9.40 ± 4.2ab | 42.56 ± 12.53ab | |
| B2F1 | 24.72 ± 3.46ab | 16.37 ± 3.2a | 65.84 ± 10.65a | |
| B2F2 | 18.72 ± 5.16ab | 8.65 ± 4.3ab | 44.14 ± 17.60ab | |
| p-value | * | * | * | |
| f-value | 2.889 | 3.688 | 3.121 | |
| Taeyangchal | B0F1 | 23.37 ± 1.2 | 10.37 ± 2.1 | 44.1 ± 7.5 |
| B0F2 | 21.87 ± 1.8 | 8.5 ± 2.7 | 38.99 ± 12.2 | |
| B1F1 | 20.27 ± 4.7 | 8.775 ± 2.9 | 56.21 ± 7.01 | |
| B1F2 | 19.37 ± 4.1 | 8.475 ± 2.3 | 43.93 ± 11.41 | |
| B2F1 | 22.55 ± 1.7 | 9.325 ± 2.7 | 41.11 ± 10.65 | |
| B2F2 | 21.42 ± 2.3 | 8.25 ± 1.9 | 44.14 ± 5.52 | |
| p-value | ns | ns | ns | |
| f-value | 0.987 | 0.393 | 0.287 | |
| ANOVA | Variety | 0.856ns | 0.170ns | 0.11ns |
| Treatment | 0.602ns | 0.367ns | 0.366ns | |
| V × T | 2.573* | 2.374ns | 0.143ns |
Mean difference of sample size (n = 3) between treatment was employment with Tukey’s test, and paired T-test was used for the different difference between treatment and varieties.
Evaluation of nitrogen use efficiency under the combination of different biochar levels and nitrogen-based fertilizers
Overall, Total nitrogen and NUE parameter (nitrogen uptake efficiency [NUpE], NUE, grain nitrogen use efficiency [gNUE], nitrogen utilization efficiency [NUtE], and nitrogen harvest index [NHI]) displayed significant differences between treatment for Mibaek#2 and no difference between treatment for Taeyangchal (Fig. 4A - F). But however, different biochar level affected Total nitrogen, NUpE, NUE, and gNUE, with B2F1 treatments showing higher efficiency compared to the other biochar treatment. The Total nitrogen (TN), concentration varies across treatment and in the variety. B2F1 treatment had the highest value in Taeyangchal, suggesting having a stronger nitrogen uptake while the rest had a lower TN value indicting optimal nitrogen assimilation under these treatments. The NUE in B2F1 treatment was 104.05% and 65.68% higher than B2F2, B1F2 for Mibaek#2 and Taeyangchal respectively. Similar observation was found in gNUE, where B2F1 treatment was 263.73% and 61.43% higher than B0F2, B2F2 for Mibaek#2 and Taeyangchal respectively. In contrast, NUpE, NHI, and NUtE were not affected by the combination of biochar and nitrogen-based fertilizer. The results reveals that NUE components were primarily influenced by fertilizer treatment rather than varietal differences. NUpE varied significantly across treatment (p = 0.002) with B1F1 and B2F1 promoting the highest uptake in both Mibaek#2 and Taeyangchal varieties similar to the study by (Badu et al., 2019; El-Syed et al., 2023). NUtE was also treatment dependent (p = 0.005) with no significant variety effect. B0F2 and B2F1 treatments resulted in the most efficient nitrogen conversion to biomass, particularly benefiting Taeyangchal, which maintained high NUtE despite lower nitrogen uptake. This indicates an adaptive mechanism allowing Taeyangchal to efficiently utilize internal nitrogen under conditions of limited availability. The overall NUE, combining uptake and utilization, was significant affected by treatment (p = 0.024). Mibaek#2 under B1F1 achieved the highest NUE, reflecting superior nitrogen efficiency potential and greater plasticity across treatment, similar to the result suggested by (Li et al., 2023). Taeyangchal overall NUE remained lower than Mibaek#2, primarily due to its more restricted nitrogen uptake. gNUE differed significantly by variety (p = 0.016) but not by treatment. Mibaek#2 consistently outperformed Taeyangchal in converting absorbed nitrogen into grain yield, particularly under B1F1 and B2F1 treatments. Taeyangchal lower gNUE suggests an inherent limitation in translating nitrogen uptake and utilization into grain production, potentially constraining yield improvements through fertilization alone. These findings validate the distinct nitrogen use strategies of the two varieties and highlight the value of PCA as a complementary tool for understanding complex NUE traits. Ultimately, optimizing biochar-based fertilizer management through treatment B1F1 and B2F1 can enhance nitrogen efficiency and productivity, especially when tailored to varietal characteristics.
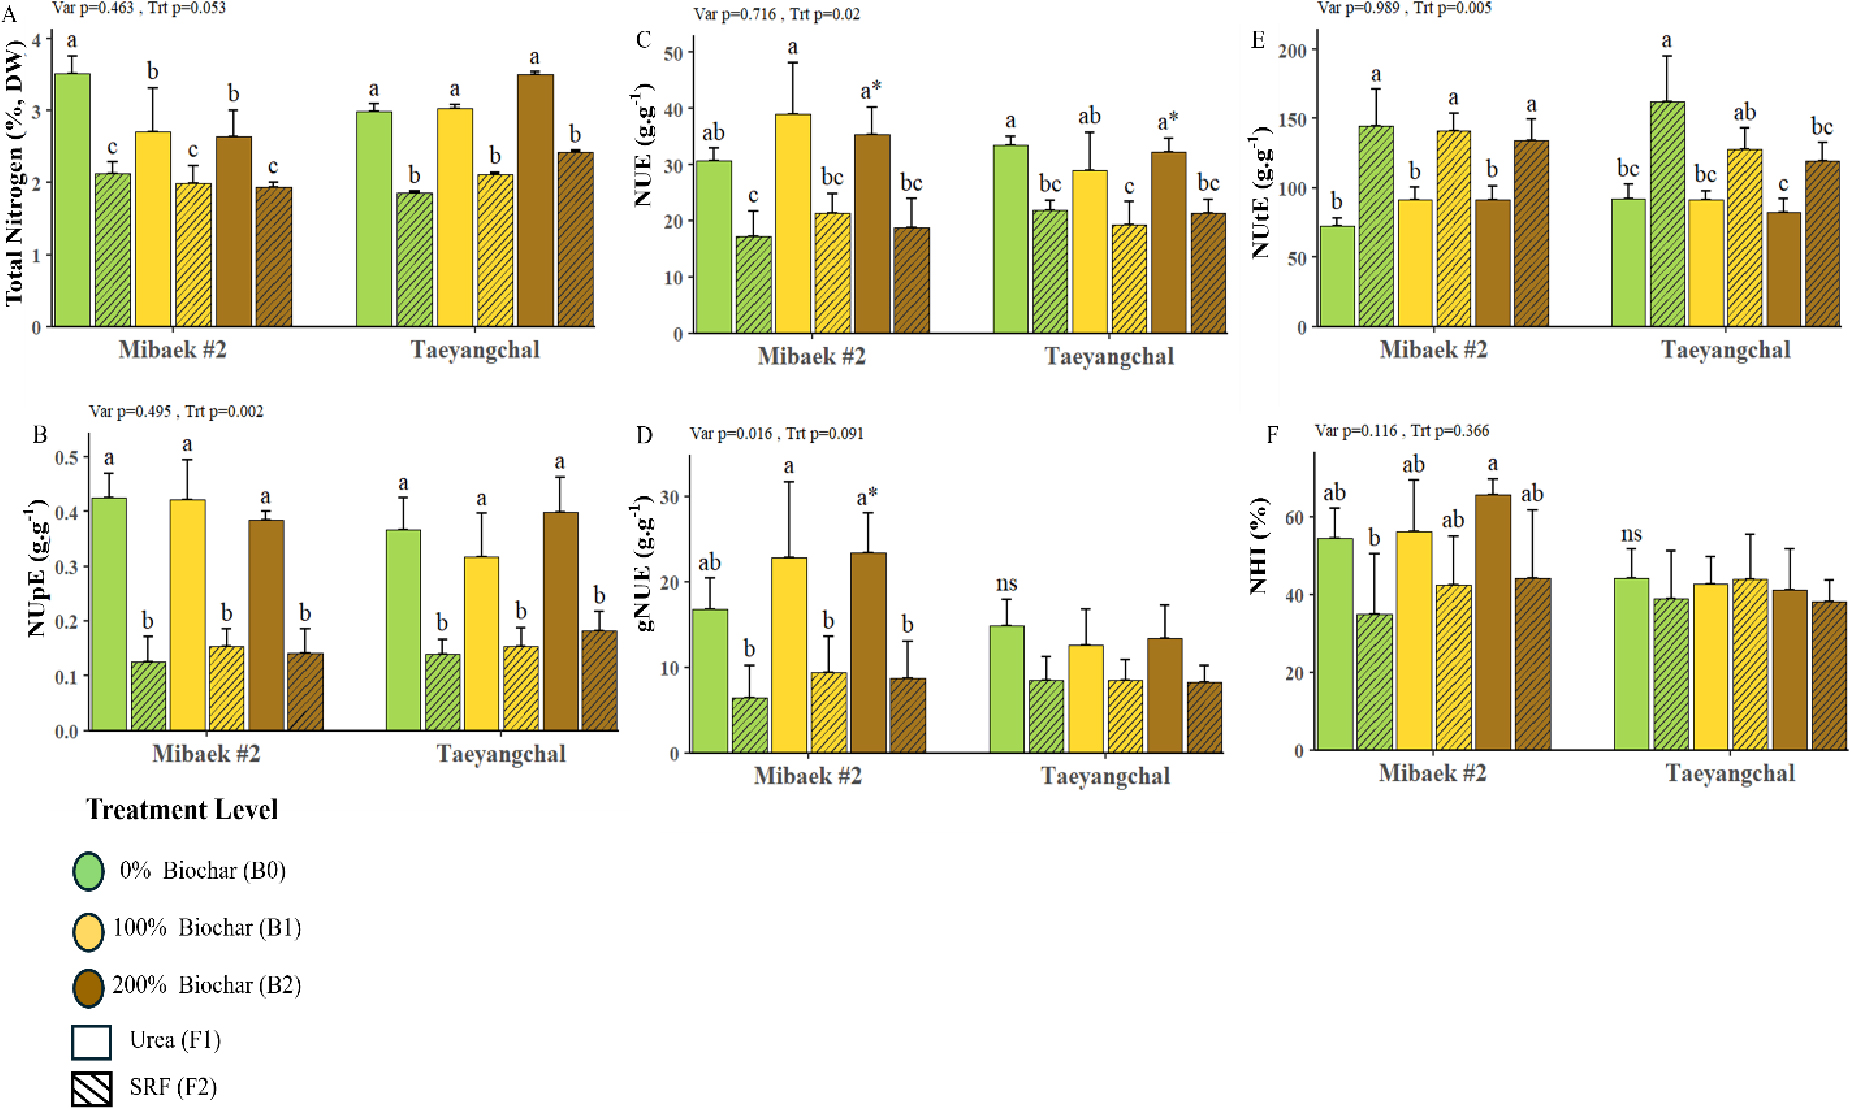
Fig. 4.
Nitrogen use efficiency indices for the combination of biochar with nitrogen-based fertilizers (urea, slow releasing fertilizer [SRF]) for different varieties Mibaek #2 and Taeyangchal. Mean difference between treatment was employment with Tukey’s test, and paired T-test was used for the different difference between treatment (Trt) and varieties (Var). NUE, nitrogen use efficiency; NUtE, nitrogen utilization efficiency; NUpE, nitrogen uptake efficiency; gNUE, grain nitrogen use efficiency; NHI, nitrogen harvest index. a - c : Different letters indicate significant differences at p < 0.05. * indicates significance at p < 0.05; ns, not significant.
Principal component analysis
PCA was performed to evaluate the relationship between NUE indices on the combination of biochar level with nitrogen-based fertilizer (urea, SRF) (Fig. 5). The analysis revealed that the treatment was distributed separately onto a loading plot. The Mibaek #2 variety of treatment B1F1, B2F1, and B2F2 were closely related to NUE, gNUE, NHI, suggesting a positive correlation between these indices. Moreover, B2F1 was also seen to have a positive relation to NUpE indices. The Taeyangchal variety of treatment B2F1 and B0F1 was seen to be positively closely related to gNUE, and also B2F1, B0F1, and B1F1 was also related to positively related to NUpE. In contrast, B0F2 and B2F2 were negatively related to NUtE. Similar findings have been reported in previous studies by (Agegnehu et al., 2016; Omara et al., 2020) found that biochar improves nitrogen uptake and grain NUE enhancing root activity and boosting nitrogen agronomic recovery, and physiological efficiencies. Therefore, these results shows that the difference in biochar level in combination with nitrogen-based fertilizers has a different responsibility for NUE in both varieties.
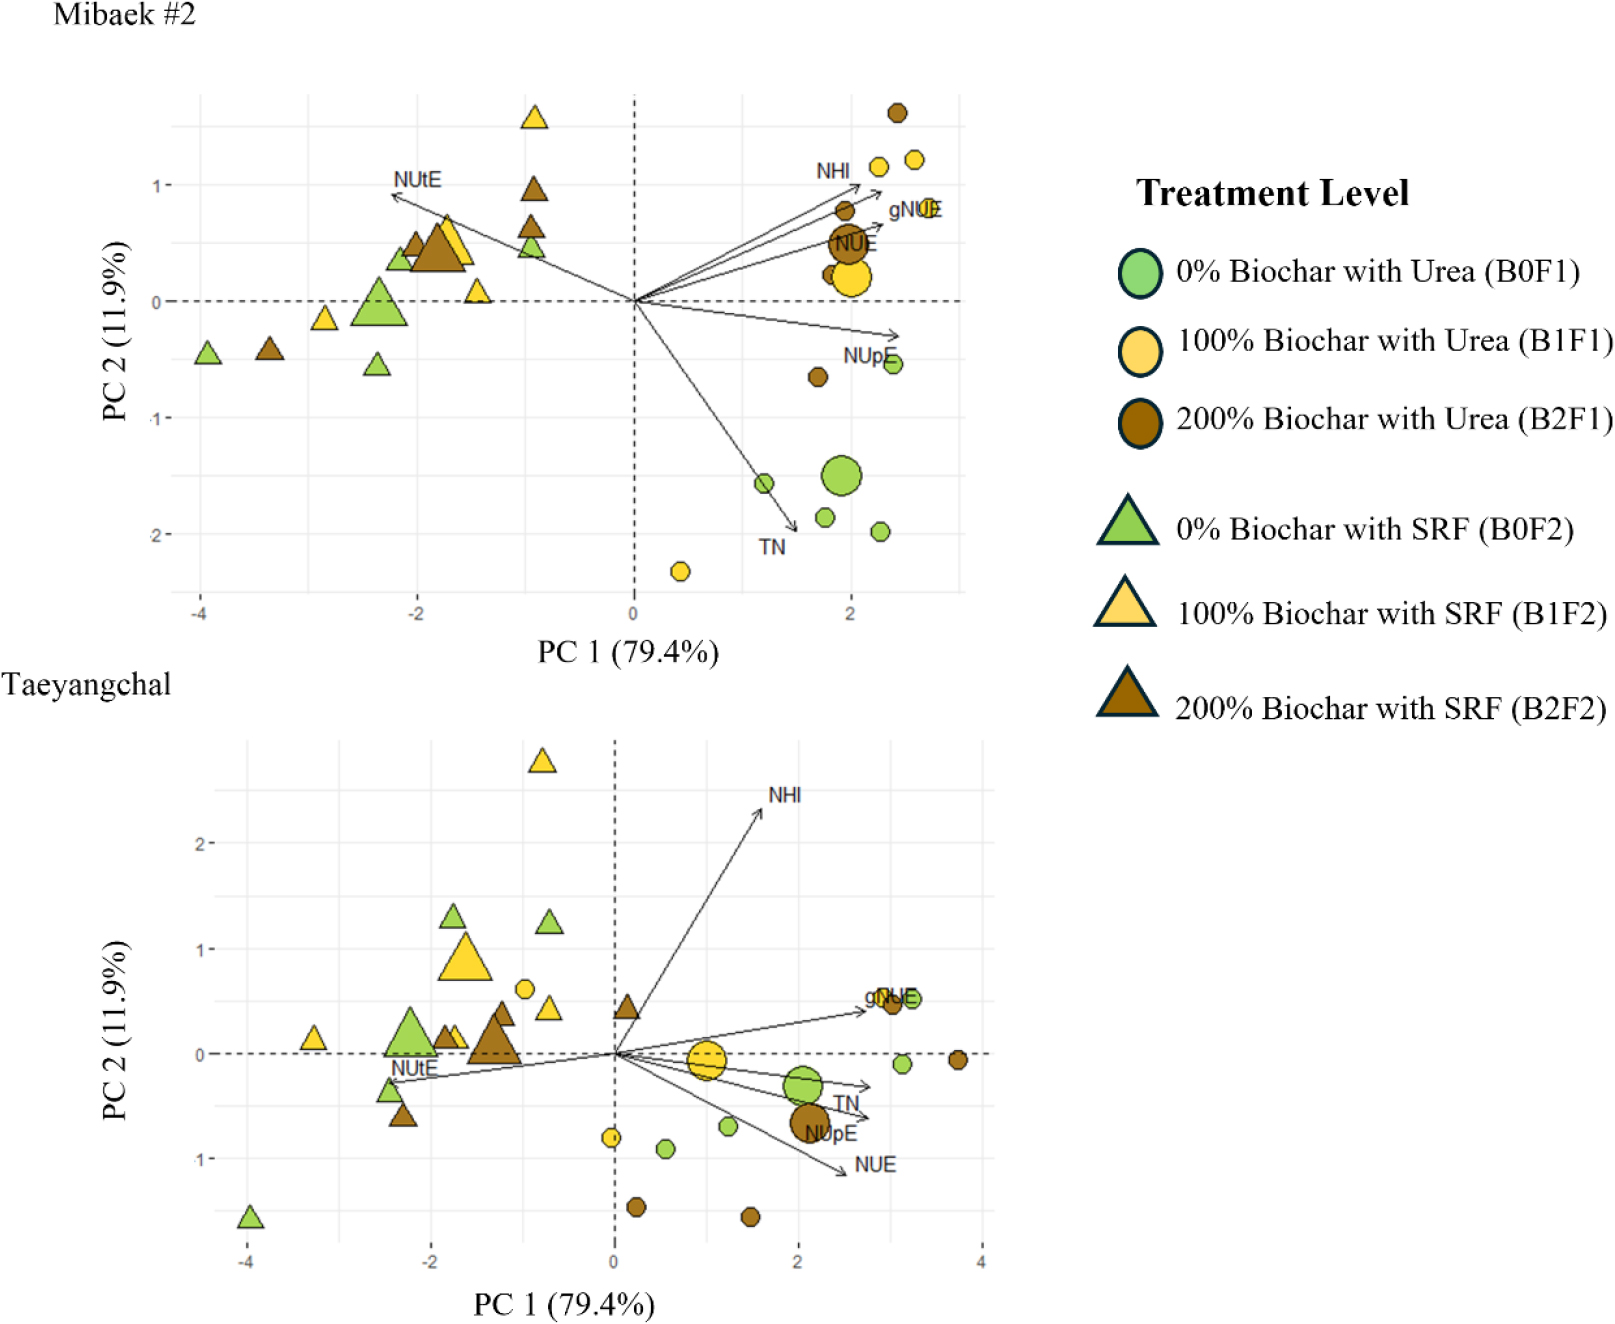
Fig. 5.
Principal component analysis (PCA) of nitrogen use efficiency indices and biochar in combination with nitrogen-based fertilizers (urea, slow releasing fertilizer [SRF]) of Mibaek #2 and Taeyangchal. PCs were extracted to describe the multivariate relations among these traits and treatments. NUtE, nitrogen utilization efficiency; NHI, nitrogen harvest index; gNUE, grain nitrogen use efficiency; NUE, nitrogen use efficiency; NUpE, nitrogen uptake efficiency.
Conclusion
This study demonstrates that the combination of biochar with nitrogen-based fertilizers significantly influence corn growth, physiological traits, yield performance and NUE. Treatment B2F1 and B1F1 consistently enhanced agronomic and physiological parameters, including plant height, grain yield, gNUE, indicating that biochar improves nutrient retention, availability and increase biomass partitioning to grain. PCA further confirmed that B2F1 consistently aligned with the most favorable NUE indices, highlighting its role as an optimal fertilization strategy. Varietal differences were also observed under the combination of biochar and nitrogen-based fertilizers, with Mibaek#2 showing a high responsiveness across most agronomic and NUE parameter, indication its capacity to capitalize on nutrient rich treatments. By contrast, Taeyangchal exhibited more stable growth with relatively high NUtE, suggesting that the variety relies on internal nitrogen management than external inputs. This research supports the targeted use of biochar and nitrogen- based fertilizers such B1F1 and B2F1 for improving nitrogen efficiency and maximizing yield, aligning with prior studies (Badu et al., 2019; Zhao and Zhang, 2021; El-Syed et al., 2023; Li et al., 2023), where biochar in combination with nitrogen fertilizers improves carbohydrate content, chlorophyll content, NUE, crop yield, and growth of plant. Collectively, these results emphasize the importance of biochar as a based fertilization for primary strategy for improving nitrogen efficiency and yield whiles also considering genotype-specific management. This underscores the necessity of tailoring fertilization strategies to crop genotype for sustainable productivity. While these findings provide significant insights, it is also important to note that the controlled greenhouse environments may not fully capture the variability present under field condition, therefore, seasonal and long-term effects were not assessed in this study. Future research should focus on multi-seasonal and field- level trials to better evaluate the broader applicability.
