Plant & Forest

Korean Journal of Agricultural Science. 1 March 2026. 35-50
https://doi.org/10.7744/kjoas.530104

ABSTRACT


MAIN

  • Introduction

  • Materials and Methods

  •   연구대상지

  •   조사 및 분석방법

  • Results and Discussion

  •   복원방법별 임분 구조 특성 변화

  •   복원방법별 토양 이화학적 특성 변화

  •   복원방법별 경제성 분석

  • Conclusion

Introduction

산불은 인위적 또는 자연적 원인에 의해 발생하며, 산림생태계의 구조와 기능에 심각한 교란을 유발한다(Hessburg et al., 2007; Kim and Lee, 2020). 특히 산불 강도와 빈도가 일정 수준을 초과할 경우, 산림의 회복력을 넘어서는 피해가 발생할 수 있는데, 이는 환경·생태적 손실을 넘어 홍수, 산사태, 토사 유출, 수산 자원의 훼손 등 다양한 2차 재해를 초래할 수 있다(Marques and Mora, 1998; Seo et al., 2010). 또한 산불 과정에서 방출되는 온실가스는 지구온난화를 가속화하고, 이는 다시 산불의 발생 빈도와 강도를 증폭시키는 악순환을 초래한다(Beverly and Martell, 2005; Lee et al., 2012; Perez-Quezada et al., 2021). 따라서 산불 관리에서는 예방이 최우선이지만, 발생 이후 신속한 원인 규명과 피해 복원, 그리고 복원 대상과 범위에 대한 우선순위 결정이 필수적이다(Lee et al., 2012; Shin et al., 2019).

산불은 식생 천이, 임목 생장, 토양의 이화학적 특성 등 다양한 생태계 요소에 영향을 미친다(McLauchlan et al., 2020; Agbeshie et al., 2022; Zhou et al., 2025). 최근 연구들은 산불이 수종 갱신에 다양한 영향을 미치고 있음을 보인다. 대표적으로 북미 방크스소나무(Pinus banksiana)는 산불 열에 의해 구과가 개방되면서 종자 발아가 촉진되는 전략을 가진다(Certini, 2005; Chae et al., 2019). 우리나라 소나무림은 산불 이후 입지 조건과 토양 비옥도, 종자원의 분포 등에 따라 다양한 방향으로 천이가 이루어지지만, 상대적으로 비옥한 토양에서는 참나무류가 우점하는 산림 구조로 전환되는 사례가 보고되고 있다(Kim et al., 2021; Choung et al., 2024). 산불은 또한 유기물층을 소실시켜 강우 후 토양 침식을 촉진하며, 강한 열로 인해 토양 발수층을 형성하여 침투량을 줄이고 지표유출을 증가시킨다(Cerda and Doerr, 2008; Kim and Im, 2019). 이러한 변화는 토양 양분의 안정성과 공급 능력에도 부정적 영향을 미친다(Agbeshie et al., 2022; Zhou et al., 2025).

최근 10년간(2016 - 2025) 우리나라에서는 연평균 529건의 산불이 발생했고 산림 피해면적은 연평균 약 14,470 ha에 달하였다(KFS, 2026). 강원도에서는 최근 10년(2014 - 2023) 동안 총 784건의 산불이 발생했고 이로 인해 약 11,014 ha의 산림이 피해를 입었다(KFS, 2024). 또한, 2025년 3월, 경상북도 의성 및 안동 일대에서 발생한 역사상 최악의 산불은 약 104,788 ha의 산림을 소실시켰다. 특히 대형 산불은 동해안 지역에서 집중적으로 발생하는데, 이는 불에 취약한 소나무림 우점, 동고서저 지형에 따른 건조한 계절풍 등 기상과 지역적 요인에 기인한다(Chung et al., 2002; Choung et al., 2004).

특히, 1996년 고성산불(3,762 ha 피해)과 2000년 동해안 산불(23,794 ha 피해)로 인해 대형 산불에 대한 국민적 관심이 높아졌다. 이를 계기로 산불 피해지의 복원 방식에 대한 사회적·학문적 논의가 활성화되었으며, 산림청은 고성 산불 피해지를 영구조사지로 지정하여 식생 변화, 토양 특성, 동물상, 수문환경 등 복원 과정 전반을 장기적으로 모니터링하고 있다(NIFoS, 2007; 2016).

산불 피해지 복원 방법은 크게 자연복원(natural regeneration, NAT)과 식재복원(planting regeneration, PLT)으로 구분된다(NIFoS, 2016). 자연복원은 초기 비용과 노동력이 적고 생물다양성 유지에 유리하지만 회복 속도가 느리고 산림의 경제성이 낮다. 반면 식재복원은 초기 식재와 관리에 비용이 소요되지만, 목표 수종을 선택적으로 도입할 수 있고 경제성이 상대적으로 높다(Lim et al., 2012; Shin et al., 2014). 따라서 산불 피해지 복원은 단순히 두 가지 방식 중 하나를 선택하는 것이 아니라, 피해 강도, 입지 조건, 토양 특성, 경제성과 생태적 기능을 종합적으로 고려해야 한다.

여러 연구들은 산불 강도가 높을수록 식생의 자연재생이 지연되고 토양 환경의 회복 또한 장기화된다고 보고하고 있으며(Hessburg et al., 2007; Keeley et al., 2009; Shin et al., 2014; NIFoS, 2016), 국내에서도 고강도 산불 지역은 저강도 산불 지역보다 회복 속도가 현저히 늦은 것으로 나타났다(Kim and Lee, 2020). 피해 강도가 높아 식생이 완전히 소실된 지역에서는 토사 유출과 천이 지연으로 인해 복원 자체가 어려워질 수 있다(Lee et al., 2004). 따라서 산불 피해지 복원은 단순히 자연복원과 식재복원 중 하나를 선택하기보다는, 피해 강도와 입지 조건을 고려하여 두 방식의 장단점을 종합적으로 반영하고, 경제성과 생태적 기능을 균형 있게 조화시키는 접근이 필요하다.

본 연구는 1996년 4월 발생한 고성 산불 피해지 영구모니터링 조사지에서 산불 발생 후 20년이 지난 시점에서 자연복원과 식재복원이 토양 특성과 산림 생산성에 미치는 영향을 규명하고, 복원 방식별 편익/비용(benefit/cost) 비율을 산출하여 경제성을 평가하였다. 본 연구의 결과는 대형 산불 피해지의 복원 전략 수립과 산림 경영 의사결정에 필요한 과학적 근거를 제시할 것으로 기대된다.

Materials and Methods

연구대상지

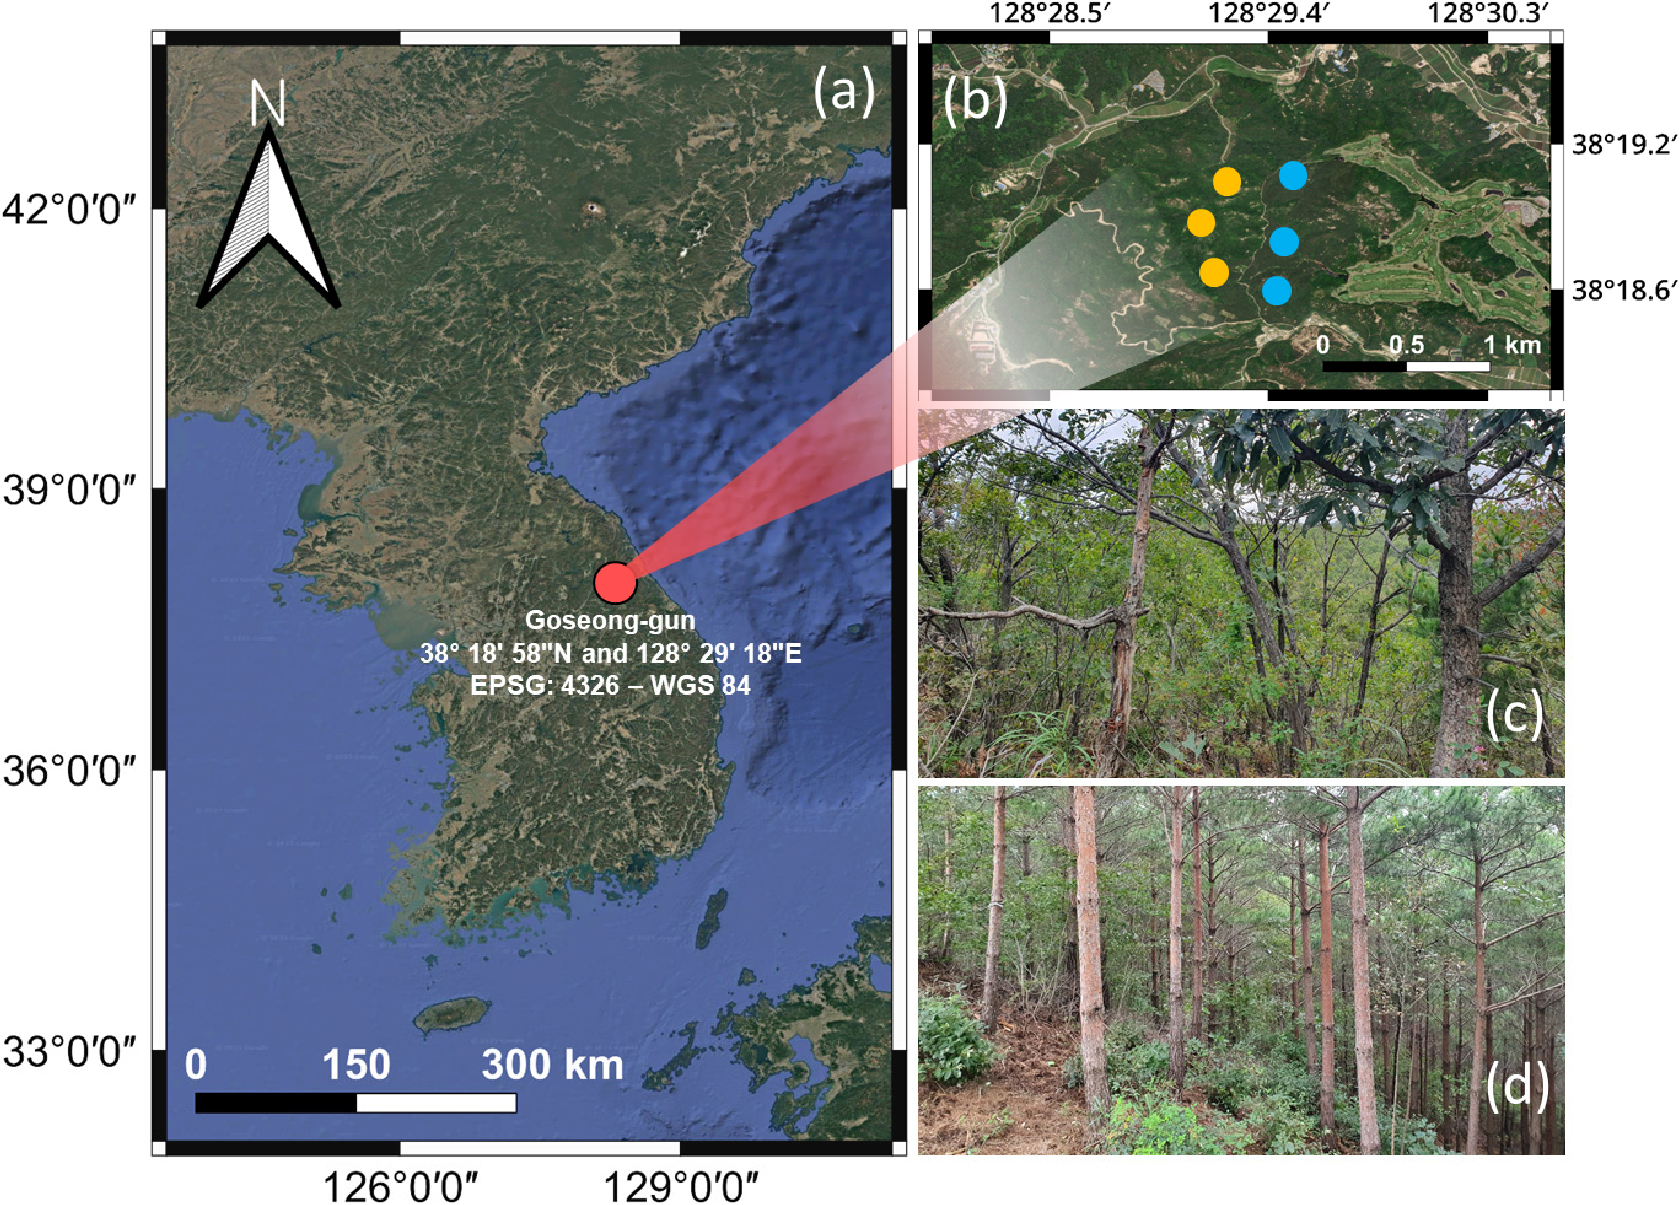
본 연구의 조사지는 강원도 고성군 죽왕면에 위치한 장기생태모니터링 연구지 내 참나무류(Quercus spp.)가 우점하는 자연복원지(NAT; N 38°19′, E 128°29′)와 소나무(Pinus densiflora) 식재복원지(PLT; N 38°18′, E 128°29′)이다(Fig. 1). 조사지역의 2001년부터 2020년까지 평균기온은 12.0°C, 연강수량은 1,434 mm였다(KMA, 2021). 본 연구지는 1996년과 2000년에 2차례 산불(수관화)에 의한 피해를 입었다. NAT는 1996년 산불이 발생한 이후, 피해입은 입목을 벌채하고, 자연복원을 유도하였다. PLT는 최초 산불 직후 해송, 자작나무, 잣나무를 식재하였고 2000년도 재피해를 입은 후에 2001년 소나무를 조림하였다. 두 임분의 사면은 NAT는 서사면, PLT는 동사면이었다. 평균경사는 NAT의 경우 25°, PLT는 16°였으며, 고도의 경우 NAT은 81 m, PLT는 96 m였다.

https://cdn.apub.kr/journalsite/sites/kjoas/2026-053-01/N0030530104/images/kjoas_2026_531_35_F1.jpg
Fig. 1.

Location of the study site and forest fire-affected areas in Goseong, Korea. (a) Geographic location of Goseong; (b) Distribution of plots in natural regeneration (NAT, ●) and planting regeneration (PLT, ●) areas; (c) Field view of NAT plot; and (d) view of PLT plot.

조사 및 분석방법

지상부 임분 구조 특성 조사

2020년 11월, NAT와 PLT 지역에 10 m × 10 m 조사구를 3반복 설치하였다. 산림 복원 방법이 수종별 생장 특성에 미치는 영향을 규명하기 위해 조사구 내 흉고직경 1 cm 이상의 모든 임목을 대상으로 수종, 흉고직경, 수고를 조사하였다. 지상부 바이오매스는 기존에 개발된 바이오매스 상대생장식과 부위별 상수를 활용하여 계산하였다(Y = aDbHc, Y: 바이오매스, D: 흉고직경, H: 수고; Table 1; NIFoS, 2014). 우리나라에서 개발된 바이오매스 상대생장식은 총 22종으로 본 연구에서는 강원지방소나무(NIFoS, 2014), 굴참나무, 상수리나무, 신갈나무, 졸참나무, 서어나무 (Han and Park, 2020) 상대생장식을 적용하였으며, 각 임목별로 잎, 가지, 줄기의 각 바이오매스를 계산하였다. 상대생장식이 개발되지 않은 수종에 대해서는 서어나무를 대상으로 도출된 상대생장식으로 나머지 수종의 바이오매스를 예측하였다.

각 복원 방법별 우점종의 최근 5년 간 흉고직경 생장을 정밀하게 비교하기 위해 조사구 당 표본목 5개체씩 생장추로 코어링을 실시하였다. 표본목 선정 시 NAT는 신갈나무, PLT는 소나무를 대상으로 육안으로 확인하였을 때 상태가 양호한 개체를 선정하였다. 코어는 실험실에 운반 후 상온에서 일주일 동안 건조하였다. 건조 후 코어의 최근 5년(2015 - 2019)간 연간 생장(단위: 0.01 mm)을 버니어캘리퍼(Mitutoyo, Japan)로 측정하였다. 생장 측정 시에는 8배줌 현미경으로 추재를 기준으로 연간 코어 생장을 구분하였다.

Table 1.

The coefficients for allometry equations of each part of species.

Species Part a b c R2
Carpinus laxifloray Stem -1.673 1.407 1.718 0.991
Branch -1.827 2.342 0.505 0.891
Foliage -3.435 0.824 2.849 0.982
Pinus densifloraz Stem 0.034 1.734 1.025 0.964
Branch 0.008 3.586 -1.158 0.757
Foliage 0.077 1.931 -0.566 0.629
Quercus acutissimay Stem 0.008 2.334 1.069 0.908
Branch 0.012 2.853 0.006 0.822
Foliage 0.008 2.518 -0.151 0.570
Quercus mongolicay Stem 0.098 1.406 1.135 0.892
Branch 0.018 3.083 -0.493 0.853
Foliage 0.023 2.609 -0.833 0.648
Quercus serratay Stem 0.046 1.988 0.759 0.976
Branch 0.019 3.500 -0.923 0.932
Foliage 0.008 2.970 -0.785 0.880
Quercus variabilisy Stem 0.053 1.810 0.881 0.938
Branch 0.082 2.553 -0.608 0.774
Foliage 1.108 1.630 -0.406 0.568

Y = aDbHc was used for allometry equations, where Y is biomass, D is diameter at breast height (DBH), and H is height.

y Based on data from Han and Park (2020). The coefficients for allometry equations were developed for over 1 cm of DBH stands.

z Based on data from NIFoS (2014). The coefficients for allometry equations were developed for over 6 cm of DBH stands.

토양 층위별 이화학적 특성 조사

토양 층위별 이화학적 특성을 조사하기 위해 2020년 11월, 모든 조사구에서 최근 교란이 일어나지 않은 지점을 1곳씩 랜덤하게 선정하였다. 각 지점별로 3 층위(0 - 10 cm, 10 - 20 cm, 20 - 30 cm)로 구분하고 깊이별 토양 샘플을 0.5 kg씩 채취하였다. 또한 층위별 가비중을 측정하기 위해 100 mL 토양 캔으로 샘플링하였다. 모든 샘플을 실험실로 운반 후 유기물 함량은 Tyurin 방법으로 측정하였다. 토양산도(pH)는 10 g의 토양을 증류수에 1 : 5의 비율로 희석하여 측정하였다. 유효인산은 Lancaster법을 이용하였고, 전질소는 1 g의 토양시료를 이용하여 Micro-Kjeldahl 법으로 측정하였다. 양이온치환능력(cation exchange capacity, CEC)은 1 N의 NH4OAc와 CH3COOH 용액으로 추출한 후 Brown 법으로 측정하였다. 분석된 각 이화학적 특성은 기존에 국립산림과학원이 보고한 고성 지역 산불 직후 토양 특성과 비교하였다(Table 2; NIFoS, 2007).

Table 2.

Soil characteristics of each soil depth in study sites in 2000.

Soil depth (cm) pH Organic matter
(%)
Total N
(%)
Available P2O5
(mg·kg-1)
CEC
(cmolc·kg-1)
0 - 5 5.3 3.4 0.13 4 10.4
5 - 15 5.1 2.2 0.09 2 10.2

CEC, cation exchange capacity.

Based on data from NIFoS (2007).

복원방법별 B/C 율 분석

산림을 복원방법별로 산림 복원 완료 시점에 참나무류와 소나무의 경제성 차이를 분석하였다. 이를 위해 복원 후 20년이 지난 현재로부터 30년 경과 후 벌기령 50년일 때 시점의 흉고직경과 수고를 활용하였다. 이 때 50년생 흉고직경은 본 연구에서 조사된 흉고직경과 최근 5년간 연평균 흉고직경 생장량으로 추정하였다(추정 흉고직경 NAT: 15.1 cm; PLT: 34.3 cm). 수고는 흉고직경을 요인으로 한 회귀분석을 통해 도출하였다(NAT: 0.135 + 1.318 × DBH, R2 = 0.863, p < 0.001; PLT: H = 3.867 + 0.487 × DBH, R2 = 0.515, p < 0.001). 임목밀도는 본 연구에서 조사된 임목밀도에서 ‘지속가능한 산림자원 관리지침’을 기준으로 하였고 최종 수확 시 자연고사율은 20%로 가정하였다. 임목의 수간재적은 ‘입목재적·바이오매스 및 임분수확표’를 참고하여 수피포함 수간재적표를 활용하였다(NIFoS, 2020).

경제성 분석을 위한 비용은 ‘지속가능한 산림자원 관리지침’에 따라 50년 벌기령 기준 풀베기, 어린나무가꾸기, 가지치기, 솎아베기, 주벌로 구분하였으며, 숲가꾸기 품셈 적용기준(KFS, 2016)과 조림비용 고시(KFS, 2020b)를 활용하여 재료비, 노무비, 경비, 일반관리비, 이윤, 부가가치세로 구분하였다. 각 비용 산정은 경사도 15 - 30°, 장애물 높이 가슴높이 이하, 집단화 면적 3 - 5 ha의 작업조건을 가정하였다. 비용 분석은 2020년 9월 11일 기준 단가를 적용하여 산출하였다(Table A1).

편익 산정은 각 시업별 고용 창출 효과와 원목 판매 가격(Kofpi, 2020)을 기준으로 하였다. 목재 판매는 참나무류는 주벌 1회, 소나무는 2차 솎아베기와 주벌 2회로 구분하였다. 선행 연구에 따르면 소나무는 흉고직경이 약 26 cm 이상일 때 조재율이 84% 이상으로 증가하는 것으로 알려져 있으며(NIFoS, 2016), 본 연구에서는 총 입목 벌채량에 대해 조재율 80%를 적용하였다. 또한, 입목의 제재목 등급은 원목규격 고시 기준에 준하여 산정하였다.

통계 분석

토양 내 탄소 및 양분함량은 층위별 가비중, 원소농도, 토양 깊이를 곱하여 양분함량을 계산하였다. 또한 복원방법에 따른 층위별 양분 분포비율(%)을 분석하였다. 토양의 이화학적 특성에 복원방법과 토양 깊이가 미치는 영향을 분석하기 위해 이원분산분석을 수행하고 Duncan의 다중비교검정(Duncan’s multiple comparison tests)을 통해 유의수준 5%에서 검정하였다. 복원방법별 지상부 임목의 부위별 바이오매스 차이도 위와 동일하게 복원방법을 요인으로 하여 분석하였다. 또한 최근 5년간의 흉고직경 생장 자료에 대해서는 복원방법별 연도 변화를 평가하기 위해 단순 선형회귀분석을 수행하였다. 통계 분석은 SPSS 22 (IBM, 2013)와 R 4.3.2 (R Core Team, 2023)를 활용하였다.

Results and Discussion

복원방법별 임분 구조 특성 변화

NAT에서는 총 7종의 활엽수가 출현하였으나, 총 1본씩만 출현한 굴참나무, 서어나무, 아까시나무를 제외하면, 신갈나무가 가장 높은 임목 밀도를 보였고 졸참나무, 당단풍나무, 산벚나무 순으로 나타났다(Table 3). 신갈나무는 주요 수종 가운데 수고와 흉고단면적이 가장 컸으며, 흉고직경은 산벚나무 다음으로 높았다. PLT에서는 소나무의 수고가 NAT의 신갈나무보다 1.4 m 높았고 흉고직경은 산벚나무보다 5.4 cm 더 컸다. 그러나 임목 밀도는 NAT가 PLT보다 약 3.4배 높았다. 이는 산불피해지에서 활엽수가 맹아 발생을 통해 빠르게 갱신·확산된 결과이며(Lee et al., 2004), PLT에서는 식재된 소나무가 낮은 밀도와 약한 경쟁 속에서 빠른 생장을 보인 것으로 보인다.

Table 3.

Species characteristics in the study sites.

Treatment Species Mean Height
(m)
Mean DBH
(cm)
Tree density
(100 trees·ha-1)
Basal area
(m2·ha-1)
NAT Acer pseudosieboldianum 2.4 (1.3) 1.9 (1.0) 4.7 (2.9) 0.41 (0.33)
Carpinus laxiflora 1.2 (na) 0.9 (na) 0.3 (na) 0.00 (na)
Prunus sargentii 8.3 (3.4) 7.0 (1.9) 1.0 (0.0) 0.44 (0.44)
Quercus mongolica 8.4 (0.7) 6.5 (0.8) 31.3 (10.5) 11.41 (0.86)
Quercus serrata 5.8 (1.3) 4.9 (0.8) 20.0 (6.1) 7.07 (4.75)
Quercus variabilis 4.7 (na) 3.6 (na) 0.3 (na) 0.00 (na)
Robinia pseudoacacia 1.7 (na) 1.6 (na) 0.3 (na) 0.06 (na)
PLT Pinus densiflora 9.8 (1.1) 12.4 (0.9) 18.3 (1.5) 23.60 (2.38)

Values in parentheses represent standard errors (n = 3).

‘na’ indicates that standard errors could not be calculated because only one individual was present across all sites.

DBH, diameter at breast height; NAT, natural regeneration; PLT, planting regeneration.

최근 5년간 연평균 흉고직경 생장량은 PLT (3.7 mm·yr-1)가 NAT (1.6 mm·yr-1)보다 유의하게 높았으며, 회귀분석 결과 PLT는 연도에 따라 유의한 증가 경향을 보였으나(y = −583.41 + 0.291 × Year, R2 = 0.105, p = 0.004), NAT는 뚜렷한 변화 경향이 나타나지 않았다(y = 84.13 − 0.0409 × Year, R2 = 0.012, p = 0.365; Fig. 2). 이는 PLT가 조림 초기부터 상대적으로 균일한 생육 환경과 관리 효과를 받아 개체 생장이 안정적으로 향상된 반면, NAT에서는 활엽수 맹아가 벌근에서 발생하여 개체 간 생장 변이가 크고, 시간이 지남에 따라 경쟁이 심화되어 생장이 둔화되는 경향을 반영한다(Lim et al., 2009). 따라서 NAT에서는 치수무육 등 천연림가꾸기를 통해 밀도 조절이 필요할 것으로 사료된다. 또한 PLT도 향후 경쟁이 심화되면서 흉고직경 연간 생장률이 감소할 가능성이 있으며, 이를 방지하기 위해 솎아베기나 시비와 같은 관리가 요구된다.
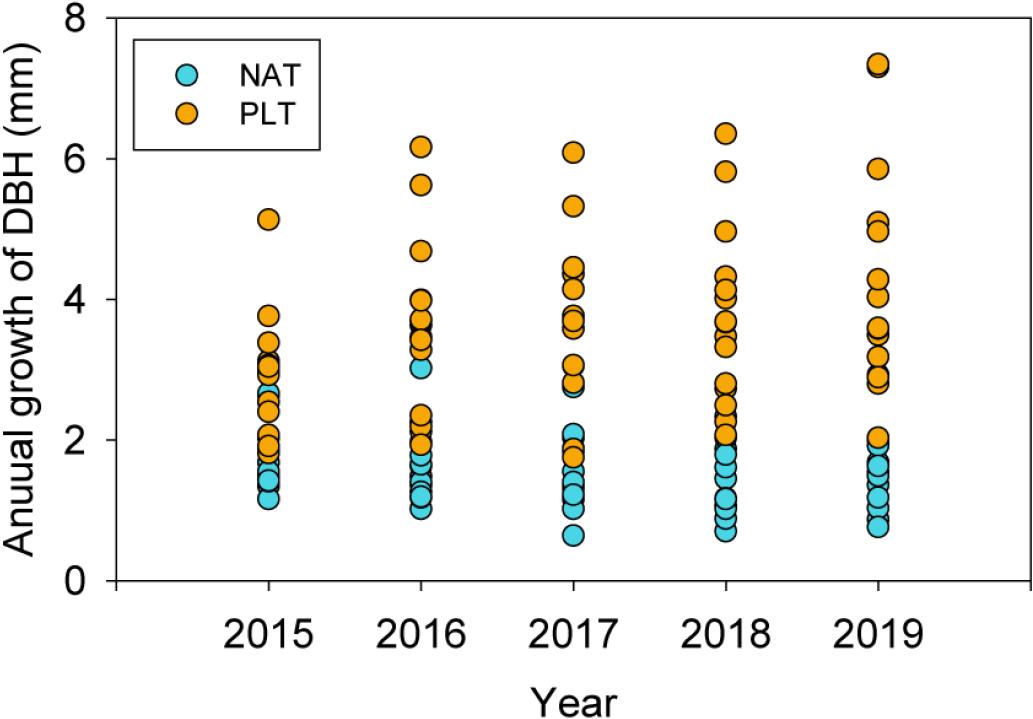
https://cdn.apub.kr/journalsite/sites/kjoas/2026-053-01/N0030530104/images/kjoas_2026_531_35_F2.jpg
Fig. 2.

Annual growth of diameter at breast height (DBH) from 2015 to 2019 in natural regeneration (NAT) and planting regeneration (PLT) areas. Dotted lines indicate linear regression models fitted to each treatment with PLT (y = −583.41 + 0.291 × Year, R2 = 0.105, p = 0.004) and NAT (y = 84.13 − 0.0409 × Year, R2 = 0.012, p = 0.365).

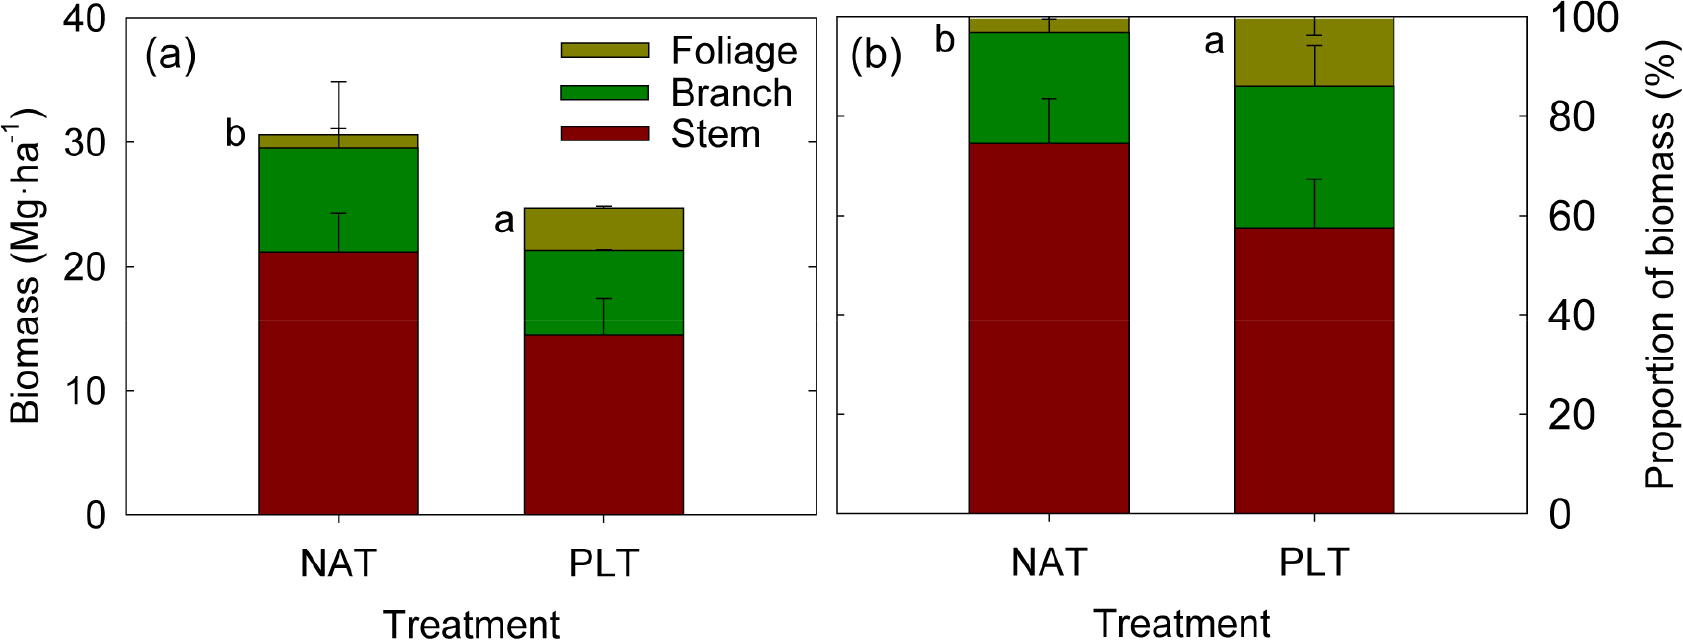
총 지상부 바이오매스는 NAT (30.6 Mg·ha-1)가 PLT (24.7 Mg·ha-1)보다 높았으나 두 처리 간 유의한 차이는 없었다(p = 0.565; Fig. 3a). 부위별로는 잎 바이오매스만 PLT가 NAT보다 유의하게 높았다(p = 0.010). 전체 임목 대비 부위별 비율은 줄기가 평균 66%로 가장 높았으며, 가지와 잎은 상대적으로 낮았다(Fig. 3b). NAT의 경우 맹아 발생으로 임목 밀도가 급격히 증가하여 수관보다 수간 성장에 더 많은 생체량이 할당되었으며, PLT는 낮은 임목 밀도로 인해 경쟁이 적어 잎과 가지의 비율이 상대적으로 높았다. 이는 임목이 초기에는 수관 형성을 위해 잎·가지 성장을 우선하다가 이후 줄기 생장을 강화한다는 일반적 경향과도 일치한다(Annighöfer et al., 2016; Çömez et al., 2019). 따라서 PLT에서는 향후 줄기 성장이 본격화되면서 NAT에 비해 지상부 전체 바이오매스가 증가량이 높아질 것으로 예상된다.

https://cdn.apub.kr/journalsite/sites/kjoas/2026-053-01/N0030530104/images/kjoas_2026_531_35_F3.jpg
Fig. 3.

Aboveground biomass amount (a) and its proportion (b) by part at the study sites. Vertical bars represent standard errors (n = 3). Different letters (a, b) show significant differences among reforestation methods (p = 0.05). NAT, natural regeneration; PLT, planting regeneration.

복원방법별 토양 이화학적 특성 변화

토양의 이화학적 특성은 유효인산과 CEC를 제외하고 대부분 복원 방법과 토양 깊이에 따라 유의한 영향을 받았다(Tables 4 and A2). 가비중은 모든 층위에서 PLT가 NAT보다 높았으며(0 - 10 cm: p = 0.025; 10 - 20 cm: p = 0.035; 20 - 30 cm: p = 0.012), 깊이가 깊어질수록 증가하였다. pH는 토양 0 - 10 cm 층위 내 복원 방법 간 차이가 없었으나(p = 0.175), 10 - 20 cm (p = 0.045)와 20 - 30 cm (p = 0.004)에서는 PLT가 NAT보다 낮았고, 전반적으로 깊이에 따라 증가하는 경향을 보였다. 유기물 함량과 전질소는 NAT가 PLT보다 높았고 층위가 깊어질수록 감소하는 양상을 보였으나 통계적으로 유의하지 않았다. 반대로 유효인산과 양이온치환용량은 PLT에서 높았으나 층위가 깊어질수록 감소하는 경향을 보였고, 복원방법 간 유의한 차이가 없었다.

Table 4.

Soil characteristics between reforestation methods of each soil depth in study sites.

Soil depth (cm) Treatment Bulk density
(g·cm-3)
pH Organic matter
(%)
Total N
(%)
Available P2O5
(mg·kg-1)
CEC
(cmolc·kg-1)
0 - 10 NAT 1.06 (0.08)b 5.9 (0.1) 3.0 (0.3) 0.10 (0.02) 9.2 (2.0) 14.7 (0.3)
PLT 1.34 (0.01)a 5.8 (0.1) 2.3 (0.2) 0.05 (0.02) 13.8 (3.0) 15.0 (0.0)
10 - 20 NAT 1.20 (0.05)b 6.1 (0.1)a 2.4 (0.2) 0.05 (0.01) 10.6 (1.7) 14.0 (1.1)
PLT 1.43 (0.05)a 5.7 (0.1)b 2.0 (0.1) 0.03 (0.00) 14.5 (4.9) 14.9 (0.2)
20 - 30 NAT 1.26 (0.02)b 6.0 (0.0)a 2.2 (0.2) 0.03 (0.01) 9.7 (1.5) 14.2 (0.9)
PLT 1.47 (0.04)a 5.8 (0.0)b 1.9 (0.1) 0.02 (0.01) 15.0 (7.1) 14.8 (0.2)

Values in parentheses represent standard errors (n = 3).

Means with the same letters (a, b) are not significantly different among the reforestation methods within each soil depth (p = 0.05).

CEC, cation exchange capacity; NAT, natural regeneration; PLT, planting regeneration.

본 결과를 국내 산림토양의 평균과 비교했을 때, NAT와 PLT 모두 가비중, pH, CEC는 높은 반면 유기물, 전질소, 유효인산은 낮은 수준이었다(Jeong et al., 2003). 토양 pH는 모암, 유기물 분해, 질산화율, 양분 가용성 등에 의해 영향을 받는 것으로 알려져 있으며(Douglas and Ballard, 1971; Kim and Oh, 2001), 산불 직후 일시적으로 증가하는 경향을 보인다. 본 연구에서도 산불 직후에 비해 pH가 11% 증가하였으며, 유효인산과 CEC 역시 각각 188%, 44% 증가하였다(Tables 2 and 3). 반면 유기물 함량과 전질소는 NAT에서 각각 12%, 23%, PLT에서 33%, 62% 감소하였다. NAT의 유기물과 질소가 PLT보다 높게 유지된 것은 활엽수 우점으로 인해 낙엽 분해가 상대적으로 빠르고, 양분 순환이 활발했기 때문으로 해석된다(Berg and McClaugherty, 2014). 반대로 PLT에서는 침엽수 조림으로 인해 낙엽낙지의 분해속도가 느려지고, 이로 인해 토양 내 유기물과 질소가 더 크게 감소했을 가능성이 있다. PLT의 유효인산 농도(13.8 mg·kg-1)는 리기다소나무(11.0 mg·kg-1)와 낙엽송 조림지(13.3 mg·kg-1)에서 보고된 값과 유사하였으나(Yang et al., 2013), NAT는 우리나라 화성암 산림토양 평균(28.7 mg·kg-1)에 비해 낮았다. 이는 시비 처리가 없었고, 양분 요구도가 큰 활엽수가 우점하여 양분 고갈이 가속화된 결과로 보인다(Hwang and Son, 2006).

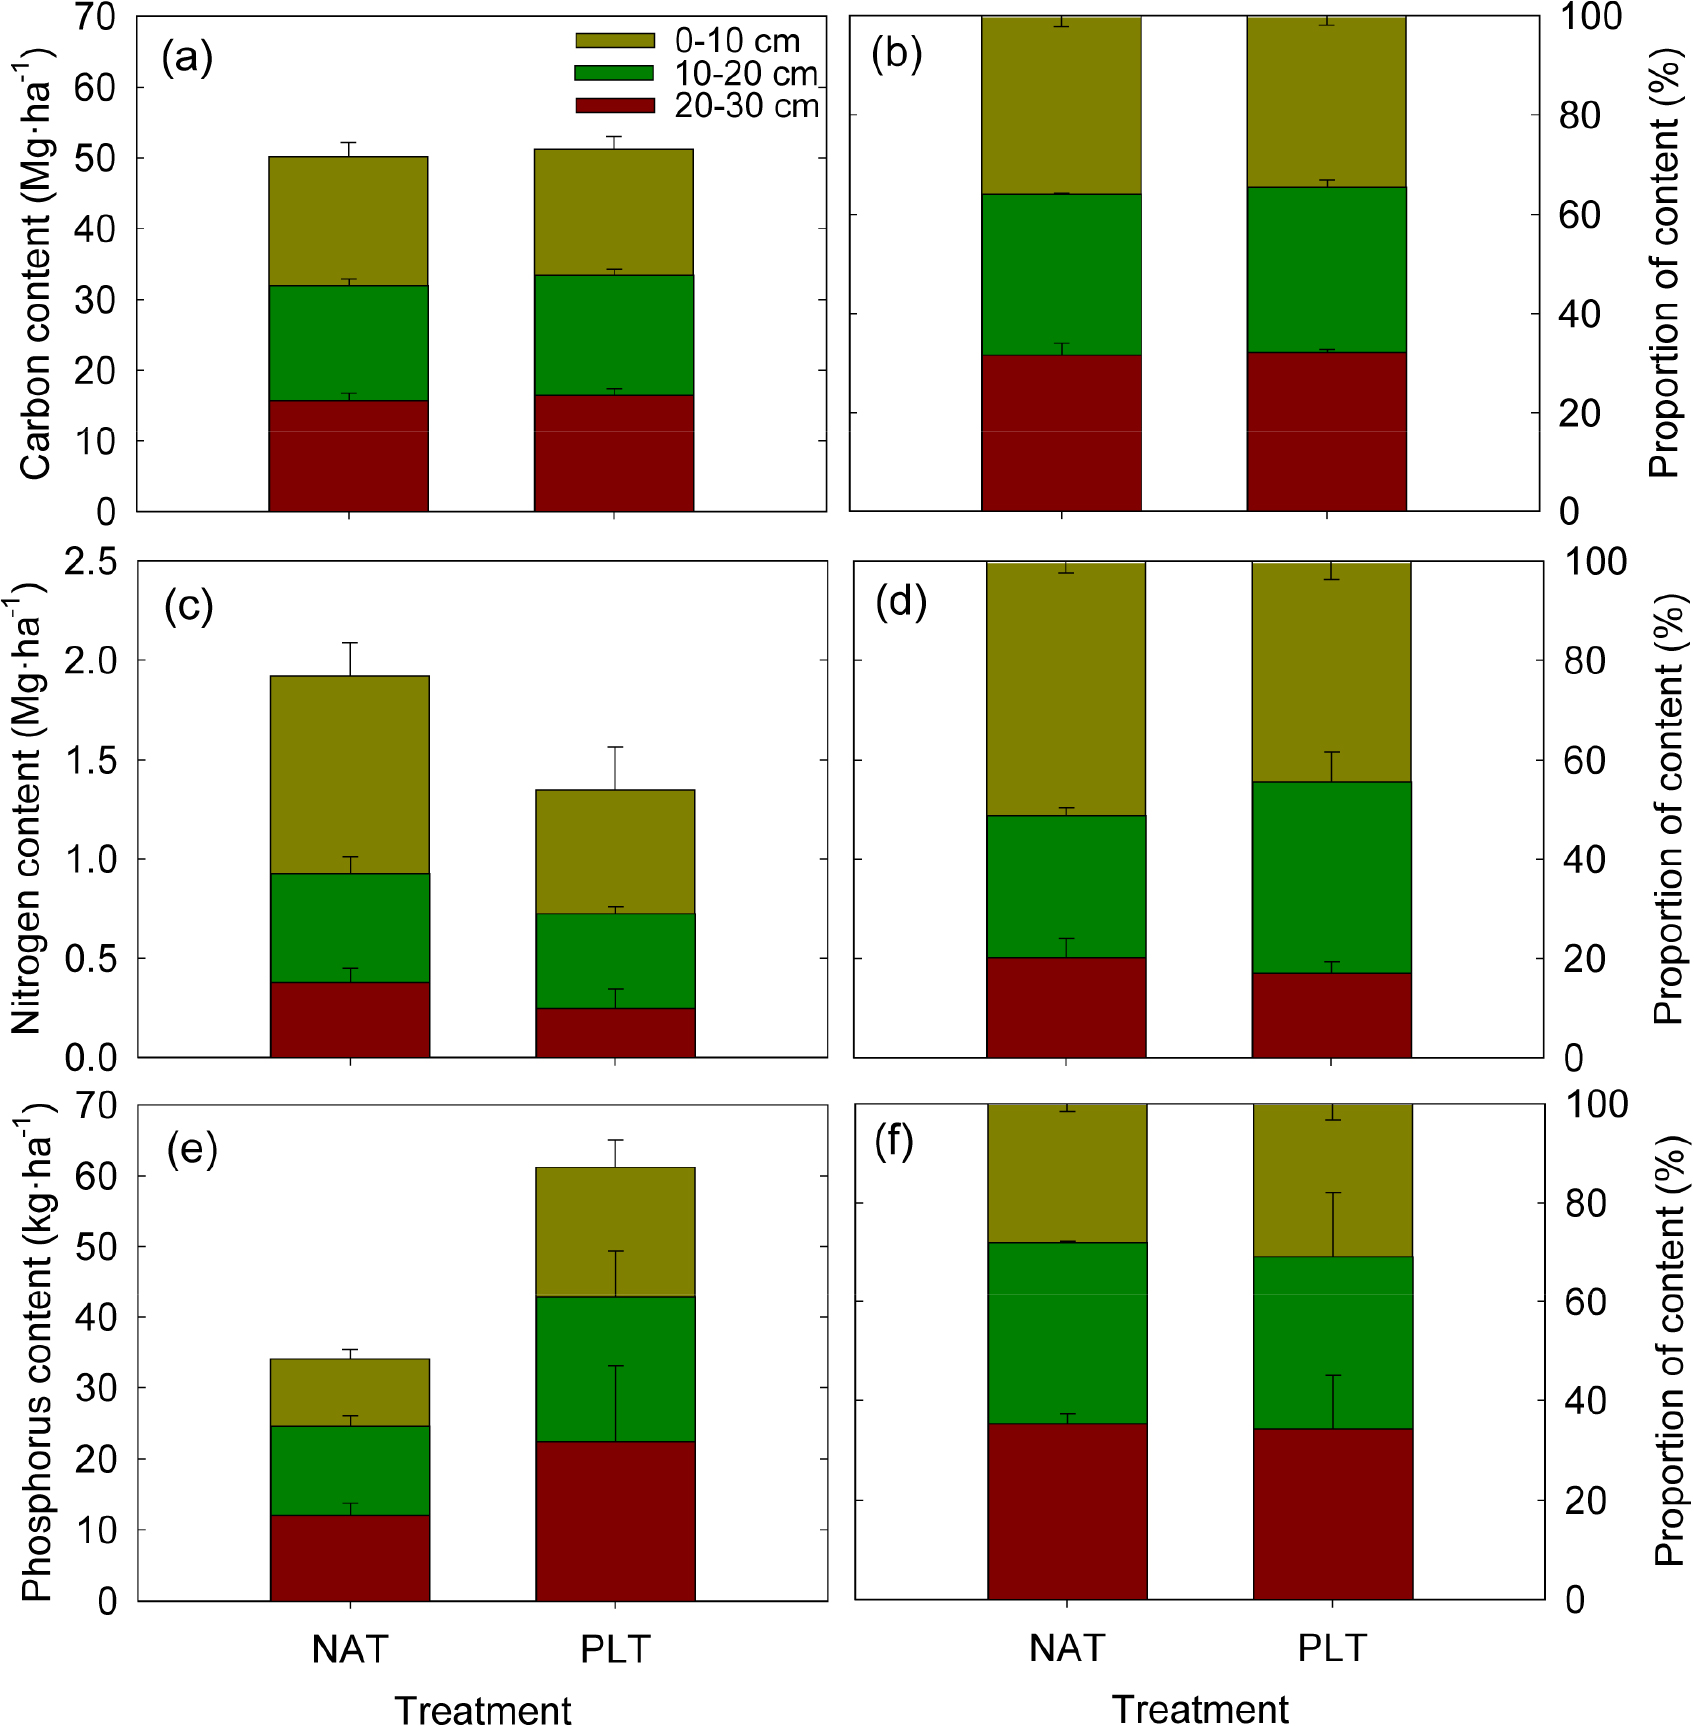
토양 양분 축적량은 복원 방법에 따른 뚜렷한 차이는 없었다(Fig. 4). 탄소 축적량은 NAT 50.1 Mg·ha-1, PLT 51.4 Mg·ha-1로 유의한 차이는 없었으며, 층위별 분포도 일정한 경향을 보이지 않았다(Fig. 4a and b). 다만 PLT가 NAT보다 소폭 높았는데, 이는 조림 과정에서 인력의 출입과 작업으로 인한 답압이 가비중 증가로 이어졌기 때문으로 추정된다. 질소 축적량은 NAT 1.9 Mg·ha-1, PLT 1.3 Mg·ha-1로 NAT가 높았으며, 특히 0 - 10 cm 층위에서는 NAT가 PLT보다 5.4% 높았다(Fig. 4c and d). 이는 NAT의 높은 임목밀도와 활엽수 우점에 따른 표층 유기물 유입이 증가하고 토양 내 얕은 층위에서 미생물 활동이 상대적으로 증가한 것에 의한 것으로 사료된다. 인 축적량은 NAT 34.1 kg·ha-1, PLT 61.2 kg·ha-1로 PLT가 1.8배 높았으나, 깊이에 따른 일정한 경향은 없었다(Fig. 4e and f). 이는 식재복원 초기 시비 효과가 장기간 지속된 결과일 수 있다(Park and Shin, 2008; Han et al., 2017).

https://cdn.apub.kr/journalsite/sites/kjoas/2026-053-01/N0030530104/images/kjoas_2026_531_35_F4.jpg
Fig. 4.

Carbon (a, b), nitrogen (c, d), and phosphorus (e, f) contents and its proportions in the 3 soil depths (0 - 10, 10 - 20, 20 - 30 cm) at the study sites. Vertical bars represent standard errors (n = 3). NAT, natural regeneration; PLT, planting regeneration.

복원방법별 경제성 분석

복원방법별 조림 후 벌기령(50년)까지의 총 비용은 PLT가 NAT보다 약 4.8배 높았다(Table 5). NAT에서는 벌기령 시 벌채와 수집 비용만 발생하였으며(Table A3), 자연복원이 목적일 경우 이 비용도 발생하지 않을 수 있다. 반면 PLT는 1차년도에 조림과 풀베기 비용이 동시에 발생하였고, 4차년도까지는 매년 숲가꾸기 비용이 투입되었다(Table A4). 가장 큰 비용은 벌기령 시 목재 생산 및 판매 과정에서 발생하였으며, 그 외에는 솎아베기, 산물수집, 어린나무가꾸기, 풀베기, 가지치기 순이었다. 복원방법별 벌기령까지 총 편익은 PLT가 NAT보다 10.2배 높았다(Table 5). NAT는 벌기령 시에만 목재 판매와 고용 편익이 발생하였으나, PLT는 1차년도부터 조림·풀베기 과정에서 고용 편익이 발생했고, 이후 숲가꾸기, 솎아베기, 주벌을 통해 지속적인 편익이 발생하였다. 가장 높은 편익은 50차년도 목재 생산 및 판매에서 나타났으며, 2차 솎아베기, 어린나무가꾸기, 풀베기, 가지치기 순으로 뒤를 이었다. 이에 따라 B/C율은 NAT 0.58, PLT 1.24로, PLT가 NAT보다 약 2.1배 높았다.

Table 5.

The cost and benefit analysis of natural regeneration (NAT) and planting regeneration (PLT) in the study area.

Year NAT PLT Operation
Cost Benefit Cost Benefit
1st 0.00 0.00 11.85 6.25 Planting and weeding
2nd 0.00 0.00 5.87 3.52 Weeding and vine removal
3rd 0.00 0.00 4.26 2.38 Weeding and vine removal
4th 0.00 0.00 2.42 1.41 Weeding
8th 0.00 0.00 2.28 1.19 Tending of young tree
20th 0.00 0.00 3.21 1.82 Thinning and pruning
30th 0.00 0.00 10.91 17.95 Thinning and product extraction
50th 12.70 11.46 53.44 82.78 Timber production and sales
Total 19.63 11.46 94.24 117.12 -

Values are in million Korean Won (KRW) per hectare (M KRW·ha-1), adjusted to the 2020 price level.

전 세계적으로 자연복원과 식재복원의 갱신 시점부터 벌기령까지 경제성 분석을 수행한 사례는 매우 적으나, 미국에서는 지역에 따라 초기 조림비용이 662 - 4,388 USD·ha-1 (0.86 - 5.70백만 원·ha-1)의 범위를 보였다(Fargione et al., 2021). 일반적으로 식재복원은 자연복원보다 관리 비용으로 인해 높게 산정된다. 우리나라 7년생 소나무 조림지에서는 식재와 5년차까지의 풀베기 비용이 10.83백만 원·ha-1였다(You et al., 2020). 또한, 폴란드 참나무 갱신지에서는 초기 6년간 비용이 자연복원 1,216 PLN·ha-1 (0.37백만 원·ha-1), 식재복원 6,543 PLN·ha-1 (1.96백만 원·ha-1)로 약 5배 차이가 났다(Kaliszewski, 2018). 본 연구에서 PLT의 3년간 비용은 21.98백만 원·ha-1였고, 초기 5년간 비용은 24.40백만 원·ha-1로 기존 사례보다 높았다. 이는 1, 2년차에 풀베기를 연 2회 실시하였고 덩굴 제거가 포함되어 연차별 비용이 상승한 데 더해, 재료비와 노무비 증가도 반영된 것으로 사료된다. 또한 산물수집 비용도 기존 연구에서는 수고 14 m, 흉고직경 16 cm, 집재재적 60 m3·ha-1인 임분에서 타워야더를 활용할 경우 1.61백만 원·ha-1이 소요되었으나(Kim and Park, 2010), 본 연구에서는 수고 9 m, 흉고직경 12 cm, 집재재적 20 m3·ha-1에서 8.49백만 원·ha-1로 약 5배 높았다. 이도 물가상승과 노동 단가 증가가 반영된 결과로 판단된다.

본 연구에서 B/C율은 PLT가 NAT보다 높게 나타나, 산불 후 식재복원이 경제성 측면에서 더 유리함을 보여주었다. 다만 임분의 생장, 비용 및 편익은 수종, 환경적 요인, 인위적 관리, 물가상승률 등 다양한 변수의 영향을 받기 때문에 기존 연구 결과와 단순 비교에는 한계가 있다. 따라서 산불과 같은 대형 재해 후에는 임분의 경영 목적을 고려하여 복원 방법을 선택하는 것이 필요할 것이다.

Conclusion

대형 산불 이후 복원 방법이 토양 특성과 산림 생산성 및 경제성에 미치는 영향을 규명하기 위해 층위별 토양 특성과 임분 구조를 분석하고, 이를 토대로 복원 방법 간 비용과 편익을 산정하였다. 토양 특성은 NAT의 pH, 유기물 함량, 전질소가 상대적으로 높았고, 가비중, 유효인산, CEC는 PLT가 높은 경향을 보였으나, 대부분 복원 방법 간 유의한 차이는 없었다. 양분 축적량 또한 탄소, 질소, 인 모두 유의한 차이는 없었으며, 탄소와 인은 PLT, 질소는 NAT가 더 높은 경향을 보였다. 임목 구조는 NAT의 임목밀도가 높았으나, PLT의 수고, 흉고단면적, 그리고 연간 흉고직경 생장량이 NAT보다 유의하게 높았다. 지상부 바이오매스는 NAT (30.6 Mg·ha-1)가 PLT (24.7 Mg·ha-1)보다 높았으나 총량의 유의한 차이는 없었고, 부위별로는 잎 바이오매스만 PLT가 NAT보다 유의하게 높았다. 경제성 분석에서는 PLT의 총 비용이 NAT보다 4.8배 높았으나 총 편익은 10.2배로 더 크게 나타나 B/C율은 PLT (1.24)가 NAT (0.58)보다 2.1배 높았다. 다만 비용과 편익은 수종 구성, 환경적 요인, 관리 여부와 강도 등 요인에 따라 달라질 수 있다. 따라서 산불 후 복원 방법은 일률적으로 적용하기보다 초기 단계에서 경영 목적을 명확히 설정하고 그 목적에 부합하는 관리 시업을 계획하는 것이 바람직할 것이다.

Conflict of Interests

No potential conflict of interest relevant to this article was reported.

Acknowledgements

This work was supported by the National Research Foundation of Korea (NRF) grant funded by the Korea government (MSIT) (No. 2021R1A2C201017812). Also, this study was conducted with the support of the R&D program for Forest Science Technology (project no. RS-2025-02219895) provided by Korea Forest Service (Korea Forestry Promotion Institute). We sincerely thank Dr. Won Seok Kang (Mokpo National University) and National Institute of Forest Science (NIFoS) for their valuable research advices and supports.

References

1

Agbeshie AA, Abugre S, Atta-Darkwa T, Awuah R. 2022. A review of the effects of forest fire on soil properties. Journal of Forestry Research 33:1419-1441.

10.1007/s11676-022-01475-4
2

Annighöfer P, Ameztegui A, Ammer C, Balandier P, Bartsch N, Bolte A, Coll L, Collet C, Ewald J, Frischbier N, et al. 2016. Species-specific and generic biomass equations for seedlings and saplings of European tree species. European Journal of Forest Research 135:313-329.

10.1007/s10342-016-0937-z
3

Berg B, McClaugherty C. 2014. Does humus accumulate and where? What factors may influence? In Plant Litter. pp. 215-234. Springer, Germany.

10.1007/978-3-642-38821-7_11
4

Beverly JL, Martell DL. 2005. Characterizing extreme fire and weather events in the Boreal Shield ecozone of Ontario. Agricultural and Forest Meteorology 133:5-16.

10.1016/j.agrformet.2005.07.015
5

Cerda A, Doerr SH. 2008. The effect of ash and needle cover on surface runoff and erosion in the immediate post-fire period. Catena 74:256-263.

10.1016/j.catena.2008.03.010
6

Certini G. 2005. Effects of fire on properties of forest soils: A review. Oecologia 143:1-10.

10.1007/s00442-004-1788-8
7

Chae JS, Kim BK, Lee JH, Lee SY. 2019. A study on mitigation of facilities damage caused by forest fire. Journal of Wellness 14:39-51. [in Korean]

10.21097/ksw.2019.08.14.3.39
8

Choung Y, Lee BC, Cho JH, Lee KS, Jang IS, Kim SH, Hong SK, Jung HC, Choung HL. 2004. Forest responses to the large-scale east coast fires in Korea. Ecological Research 19:43-54.

10.1111/j.1440-1703.2003.00607.x
9

Choung Y, Lee KS, Oh HK, Cho S, Kim Y, Lee K, Lee J, Jung S. 2024. Fire-induced shift from Pinus to Quercus forests: A twenty-year study following the 1996 Goseong forest fire. Journal of Ecology and Environment 48:473-484.

10.5141/jee.24.089
10

Chung J, Lee B, Kim H. 2002. Estimation of Pinus densiflora stand damage grades for Samchuck forest fire area using GIS and discriminant analysis. Journal of Korean Forestry Society 91:355-361. [in Korean]

11

Çömez A, Tolunay D, Güner ŞT. 2019. Litterfall and the effects of thinning and seed cutting on carbon input into the soil in Scots pine stands in Turkey. European Journal of Forest Research 138:1-14.

10.1007/s10342-018-1148-6
12

Douglas GW, Ballard TM. 1971. Effects of fire on alpine plant communities in the North Cascades, Washington. Ecology 52:1058-1064.

10.2307/1933813
13

Fargione J, Haase DL, Burney OT, Kildisheva OA, Edge G, Cook-Patton SC, Chapman T, Rempel A, Hurteau MD, Davis KT, et al. 2021. Challenges to the reforestation pipeline in the United States. Frontiers in Forests and Global Change 4:629198.

10.3389/ffgc.2021.629198
14

Han SH, Meng L, Park GS, Kim SB, Cho MS, Park BB. 2017. Characteristics of soil carbon and nutrient stocks across land use types in a forest region of central Korea. Forest Science and Technology 13:93-99.

10.1080/21580103.2017.1341434
15

Han SH, Park BB. 2020. Comparison of allometric equation and destructive measurement of carbon storage of naturally regenerated understory in a Pinus rigida plantation in South Korea. Forests 11:425.

10.3390/f11040425
16

Hessburg PF, Salter RB, James KM. 2007. Re-examining fire severity relations in pre-management era mixed conifer forests: Inferences from landscape patterns of forest structure. Landscape Ecology 22:5-24.

10.1007/s10980-007-9098-2
17

Hwang J, Son Y. 2006. Short-term effects of thinning and liming on forest soils of pitch pine and Japanese larch plantations in central Korea. Ecological Research 21:671-680.

10.1007/s11284-006-0170-1
18

IBM. 2013. IBM SPSS Statistics for Windows. Ver. 22.0. Armonk, NY: IBM Corp.

19

Jeong J, Kim C, Goo K, Lee C, Won H, Byun J. 2003. Physico-chemical properties of Korean forest soils by parent rocks. Journal of Korean Forest Society 92:254-262. [in Korean]

20

Kaliszewski A. 2018. Cost analysis of artificial and natural oak regeneration in selected forest districts. Forest Research Papers 78:315-321.

10.1515/frp-2017-0035
21

Keeley JE, Aplet GH, Christensen NL, Conard SG, Johnson EA, Omi PN, Peterson DL, Swetnam TW. 2009. Ecological Foundations for Fire Management in North American Forest and Shrubland Ecosystems. General Technical Report PNW-GTR-779. US Department of Agriculture, Forest Service, Pacific Northwest Research Station.

10.2737/PNW-GTR-779
22

KFS (Korea Forest Service). 2016. Guidelines for forest tending design, supervision, and implementation. Official Notice No. 1294. Accessed in https://www.law.go.kr/LSW/admRulInfoP.do?admRulSeq=2100000050652 on September 2020. [in Korean]

23

KFS (Korea Forest Service). 2020a. Guidelines for forest tending design, supervision, and implementation. Official Notice No. 1455. Accessed in https://www.law.go.kr/LSW/admRulLsInfoP.do?chrClsCd=&admRulSeq=2100000190247 on September 2020. [in Korean]

24

KFS (Korea Forest Service). 2020b. Notice of forestation cost in 2020. KFS Notice No. 2020-4. Accessed in https://www.law.go.kr/LSW/admRulInfoP.do?admRulSeq=2100000185966 on September 2020. [in Korean]

25

KFS (Korea Forest Service). 2020c. Seed and seedling prices for forestry in Korea & afforestation cost notice. Accessed in https://www.forest.go.kr/kfsweb/kfi/kfs/cms/cmsView.do?mn=AR01_01_06&cmsId=FC_003811 on 11 September 2020. [in Korean]

26

KFS (Korea Forest Service). 2024. Ten-year (2014–2023) statistics of wildfire occurrence by region in Korea. Accessed in https://www.forest.go.kr/kfsweb/kfi/kfs/frfr/selectFrfrStatsArea.do on 10 November 2024. [in Korean]

27

KFS (Korea Forest Service). 2026. Ten-year (2016–2025) statistics of wildfire occurrence in Korea. Accessed in https://www.forest.go.kr/kfsweb/kfi/kfs/frfr/selectFrfrStats.do?mn=AR04_01_03 on 2 February 2026. [in Korean]

28

Kim D, Lee Y. 2020. Classification of wildfire burn severity using the clustering methods with Sentinel-2 images. Journal of Climate Research 15:173-185. [in Korean]

10.14383/cri.2020.15.3.173
29

Kim JG, Oh KC. 2001. Changes of chemical and microbial properties of soils after forest fires in coniferous and deciduous forests. The Korean Journal of Ecology 24:1-7. [in Korean]

30

Kim JH, Park SJ. 2010. An analysis of the yarding productivity and cost in forest tending operation. Journal of Korean Forest Society 99:625-632. [in Korean]

31

Kim TH, Im SJ. 2019. Analyzing the temporal changes of surface runoff, soil erosion, and TOC concentration in burnt soils using rainfall simulation experiments. Journal of the Korea Society of Forest Engineering and Technology 17:143-152. [in Korean]

32

Kim Y, Jeong MH, Youm M, Kim J, Kim J. 2021. Recovery of forest vegetation in a burnt area in the Republic of Korea: A perspective based on Sentinel-2 data. Applied Sciences 11:2570.

10.3390/app11062570
33

KMA (Korea Meteorological Administration). 2021. Annual Climatological Report 2020. [in Korean]

34

Kofpi (Korea Forestry Promotion Institute). 2020. Trends in Domestic Log Market Prices in Winter 2020 (Fourth Quarter). [in Korean]

35

Lee BD, Youn HJ, Koo KS, Kim KH. 2012. Estimation of biomass loss and greenhouse gases emissions from surface layer burned by forest fire. Journal of Korean Forest Society 101:286-290. [in Korean]

36

Lee KS, Choung Y, Kim SC, Sook S, Ro CH, Park SD. 2004. Development of vegetation structure after forest fire in the east coastal region, Korea. The Korean Journal of Ecology 27:99-106. [in Korean]

10.5141/JEFB.2004.27.2.099
37

Lim JH, Ji DH, Lee YG, Lee MB. 2009. Study on the management system of oak coppice forest on forest fire site. Journal of Korean Forest Society 98:652-658. [in Korean]

38

Lim JH, Kim JH, Bae SW. 2012. Natural regeneration patten of pine seedlings on the burned forest site in Gosung, Korea. Korean Journal of Agricultural and Forest Meteorology 14:222-228. [in Korean]

10.5532/KJAFM.2012.14.4.222
39

Marques MA, Mora E. 1998. Effects on erosion of two post-fire management practices: Clear-cutting versus non-intervention. Soil and Tillage Research 45:433-439.

10.1016/S0933-3630(97)00039-1
40

McLauchlan KK, Higuera PE, Miesel J, Rogers BM, Schweitzer J, Shuman JK, Tepley AJ, Varner JM, Veblen TT, Adalsteinsson SA, et al. 2020. Fire as a fundamental ecological process: Research advances and frontiers. Journal of Ecology 108:2047-2069.

10.1111/1365-2745.13403
41

NIFoS (National Institute of Forest Science). 2007. Investigation of Changes in the Ecosystem in Areas Affected by Forest Fires. 240 pp. [in Korean]

42

NIFoS (National Institute of Forest Science). 2014. Carbon Emission Factors and Biomass Allometric Equations by Species in Korea. 96 pp. [in Korean]

43

NIFoS (National Institute of Forest Science). 2016. Ecosystem Change Monitoring and Recovery Management Technology Development in Areas Affected by Forest Fires. 180 pp. [in Korean]

44

NIFoS (National Institute of Forest Science). 2020. Standard Yield Table of Growing Stock, Biomass, and Stand Volume. 391 pp. [in Korean]

45

Park BB, Shin JH. 2008. Soil organic matter and nutrient accumulation at the abandoned fields. Journal of Korean Forest Society 97:492-500.

46

Perez-Quezada JF, Urrutia P, Olivares-Rojas J, Meijide A, Sánchez-Cañete EP, Gaxiola A. 2021. Long term effects of fire on the soil greenhouse gas balance of an old-growth temperate rainforest. Science of the Total Environment 755:142442.

10.1016/j.scitotenv.2020.142442
47

R Core Team. 2023. R: A Language and Environment for Statistical Computing. Ver. 4.3.2. Austria: R Foundation for Statistical Computing.

48

Seo JI, Chun KW, Kim SW, Kim MS. 2010. Rainfall pattern regulating surface erosion and its effect on variation in sediment yield in post-wildfire area. Journal of Korean Forest Society 99:534-545. [in Korean]

49

Shin JI, Seo WO, Kim T, Woo C, Park J. 2019. Analysis of availability of high-resolution satellite and UAV multispectral images for forest burn severity classification. Korean Journal of Remote Sensing 35:1095-1106. [in Korean]

10.7780/KJRS.2019.35.6.2.6
50

Shin MH, Lim JH, Kong WS. 2014. Relationship between environment factors and distribution of Pinus densiflora after fire in Goseong, Gangwon province, Korea. Journal of the Korean Society of Environmental Restoration Technology 17:49-60. [in Korean]

10.13087/kosert.2014.17.2.49
51

Yang AR, Hwang J, Cho M, Song SW. 2013. Soil physical and chemical properties with plantation regions and stand age in Pinus rigida and Larix kaempferi plantations. Journal of Korean Forest Society 102:578-586. [in Korean]

10.14578/jkfs.2013.102.4.578
52

You JW, Won HK, Han H, Kim HS. 2020. A comparative analysis of management efficiency between natural regeneration and plantation. Korean Journal of Forest Economics 27:85-91. [in Korean]

10.31541/KJFE.27.2.7
53

Zhou Y, He K, Hu X, Gong X, Jin T, Wu Z, Zhong Y. 2025. Post-wildfire soil properties changes: Insights into hillslope erosion after the March 2024 Yajiang Fire. Journal of Geophysical Research: Earth Surface 130:e2024JF008115.

10.1029/2024JF008115

Appendix

Table A1.

The unit cost of variable factors.

Factors Type Cost
Price of labor (KRW·person-1·day-1) General worker 139,989
Skilled worker 167,926
Machine operator 203,878
Oil price (KRW·L-1) Gasoline 1,238
Diesel 1,058
Price of timber (KRW·m-3)
Pinus densiflora 1st grade 243,000
2nd grade 159,000
Quercus spp. 2nd grade 115,000

All costs are as of September 11th, 2020.

Table A2.

Results of two-way ANOVA of treatment of reforestation method with soil depth and their interactions on the mean values of each soil characteristics in research areas.

Factors Bulk density pH Organic matter Total N Available P2O5 CEC
Treatment < 0.0010.0010.0270.031 0.176 0.244
Depth 0.016 0.682 0.0340.008 0.962 0.784
T × D 0.794 0.233 0.513 0.294 0.983 0.872

Values in bold are considered statistically significant (p = 0.05).

CEC, cation exchange capacity.

Table A3.

The unit cost of variable factors of each operation in natural regeneration (NAT) area.

Operation Cost Benefity
Product extraction (harvesting)z
    Materials 0.36 -
    Labor 3.99 3.58
    Others 2.87 -
    Forest owner’s cost 5.49 -
    Timber sales (68.5 m3·ha-1) - 7.88

Values are in million Korean Won (KRW) per hectare (M KRW·ha-1).

Unit costs under work conditions: Slope 15 - 30° (+5%), obstacles below breast height (0), stand aggregation 3 - 5 ha (+5%).

y Benefit of labor was calculated based soley on hired labor, and indirect labor cost were not included.

z Based on data from KFS (2020a).

Table A4.

The unit cost of variable factors of each operation in planting regeneration (PLT) area.

Operation Cost Benefitx
Site preparation and planting (5,000 trees·ha-1)y
    Materials 0.70 -
    Labor 3.91 3.50
    Others 2.92 -
    Forest owner’s cost 0.60 -
Circular weeding (remained 5,000 trees·ha-1)z
    Materials 0.00 -
    Labor 1.54 1.39
    Others 0.75 -
Full weeding until 2nd year (remained 5,000 trees·ha-1)z
    Materials 0.02 -
    Labor 1.32 1.19
    Others 0.68 -
Full weeding after 3rd year (remained 5,000 trees·ha-1)z
    Materials 0.03 -
    Labor 1.57 1.41
    Others 0.82 -
Vine removalz
    Materials 0.05 -
    Labor 1.19 0.97
    Others 0.60 -
Tending of young tree (remained 1,800 trees·ha-1 with pruning for 500 tree·ha-1)z
    Materials 0.04 -
    Labor 1.36 1.22
    Others 0.72 -
Puning (500 tree·ha-1)z
    Materials 0.00 -
    Labor 0.05 0.47
    Others 0.03 -
Thinning 1st (DBH 13 cm, Remained 1,100 trees·ha-1)z
    Materials 0.05 -
    Labor 1.55 1.35
    Others 0.83 -
Thinning 2nd (DBH 20 cm, Remained 600 trees·ha-1)z
    Materials 0.04 -
    Labor 1.15 1.03
    Others 0.62 -
Product extraction (2nd thinning)z
    Materials 0.43 -
    Labor 4.72 4.72
    Others 3.34 -
    Timber sales (81.32 m3·ha-1) - 12.20
Product extraction (harvesting)z
    Materials 1.41 -
    Labor 16.77 15.64
    Others 11.29 -
    Timber sales (299.8 m3·ha-1) - 85.04

Values are in million Korean Won (KRW) per hectare (M KRW·ha-1).

Unit costs under work conditions: Slope 15 - 30° (+5%), obstacles below breast height (0), and stand aggregation 3 - 5 ha (+5%).

DBH, diameter at breast height.

x Benefit of labor was calculated based soley on hired labor, and indirect labor cost were not included.

y Based on data from KFS (2020c).

z Based on data from KFS (2020a).

페이지 상단으로 이동하기