

Introduction
Materials and Methods
Phenotype data
Genotype data
Statistical analysis
Results
Discussion
Conclusion
Introduction
Marbling is one of the most critical indicators of beef quality and various countries have established marbling-based standards for evaluating meat quality grades. In premium beef markets, such as Korea and Japan, where consumers prefer richly marbled meat, interest has grown not only in the amount of marbling but also in its visual characteristics—specifically, finely distributed, small flecks of intramuscular fat rather than coarse clumps (Hocquette et al., 2010; Lee et al., 2025).
Highly marbled beef contains elevated levels of monounsaturated fatty acids, particularly oleic acid, which is associated with more favorable blood lipid profiles than saturated fats (Hocquette et al., 2010; Smith, 2016). However, concerns about excessive fat intake among health-conscious consumers have increased demand for beef with fine and evenly distributed marbling (Kris-Etherton et al., 1999; WHO, 2003; Lee et al., 2025).
Image analysis has been widely adopted to objectively assess marbling fineness (MF). In Japanese Black cattle, for example, cross-sectional images of the longissimus dorsi muscle are captured using imaging devices, and marbling particles were analyzed to evaluate their coarseness and fineness (Kuchida et al., 2006; Kuchida and Kanai, 2012).
Recently, an image-based index known as the F7 index was developed to quantify MF in Hanwoo cattle (Lee et al., 2020; 2025). In this study, we utilized the F7 index to estimate the genetic parameters of MF and evaluated its potential as a novel trait by estimating genomic breeding values and their prediction accuracies. This approach reflects the growing consumer interest in not only the quantity but also the quality of marbling in Hanwoo beef, offering an additional means for improving beef quality evaluation systems.
Materials and Methods
Phenotype data
Phenotypic records for four carcass traits—carcass weight (CWT), back fat thickness (BFT), eye muscle area (EMA), and marbling score (MS)—and MF were collected from highly marbled Hanwoo steers (MS grades 6 - 9) slaughtered between 2021 and 2024 at a slaughterhouse in Pyeongchang, Gangwon Province, Korea. According to national carcass grading standards, the longissimus dorsi muscle was transversely sectioned between the last thoracic and first lumbar vertebrae for carcass imaging and trait measurement.
MF was evaluated using the F7 index calculated from images obtained at the carcass grading site using the KBM1 image analyzer (Insilicogen Inc., Korea), with the cooperation of the Korea Institute for Animal Products Quality Evaluation (KAPE). To ensure consistency, all images were acquired by the same individual. The F7 index quantifies MF by computing the standard deviation of the marbling particle-to-tile area ratio across 40 × 40 tiles within each image. The F7 index was defined as follows (Lee et al., 2020; 2025):
where, is the total number of tiles, is the ratio of marbled particle area to tile area in the th tile, and is the average ratio across all tiles.
Phenotypic data for all five traits were subjected to quality control using the interquartile range (IQR) method, resulting in a final dataset of 1,156 animals.
Genotype data
Genotype data were obtained by extracting DNA from tissue samples and performing genotyping using the Illumina BovineSNP50 version 3 and HanwooSNP50 version 1 arrays. The two datasets were merged using PLINK version 1.9 (Chang et al., 2015; Purcell and Chang, 2025), and overlapping SNPs located at the same genomic positions in both arrays were removed. SNP markers were further filtered based on the following quality control criteria: SNP call rate < 90%, minor allele frequency < 0.01, and significant deviation from Hardy-Weinberg equilibrium (p < 0.001). After filtering, 45,553 SNP markers remained for subsequent analyses.
Statistical analysis
Phenotypic records were adjusted using a linear model that included the fixed effects of slaughter year, season, and farm, with slaughter age as a covariate. MS is an ordinal categorical trait and was therefore treated as continuous, following common practice in beef cattle genetic evaluations.
The genomic estimated breeding values (gEBVs) and genetic parameters were estimated using the genomic best linear unbiased prediction (GBLUP) method implemented in the BLUPF90 software suite. The statistical model was as follows:
where, is the vector of phenotypic records; and are incidence matrices for fixed and random additive genetic effects, respectively; is the vector of fixed effects; is the vector of random additive genetic effects; is the vector of residuals; is the genomic relationship matrix; and is the identity matrix. represents the additive genetic variance, and denotes the residual variance.
Heritability was calculated as:
To assess the relationship between gEBVs and observed phenotypes for each trait, Pearson correlation coefficients (r) and their statistical significance were calculated. Linear regression analyses were conducted to determine the coefficients of determination (R2), and scatter plots were generated for each trait.
Theoretical accuracy, based on prediction error variance (PEV), was calculated as:
Realized accuracy, defined as the Pearson correlation between predicted gEBVs and observed phenotypes for individuals with masked validation, was calculated as:
where, and represent observed phenotypes and predicted gEBVs, respectively, for validation animals. A five-fold cross-validation procedure was used, with 20% of animals masked as validation individuals in each fold.
Results
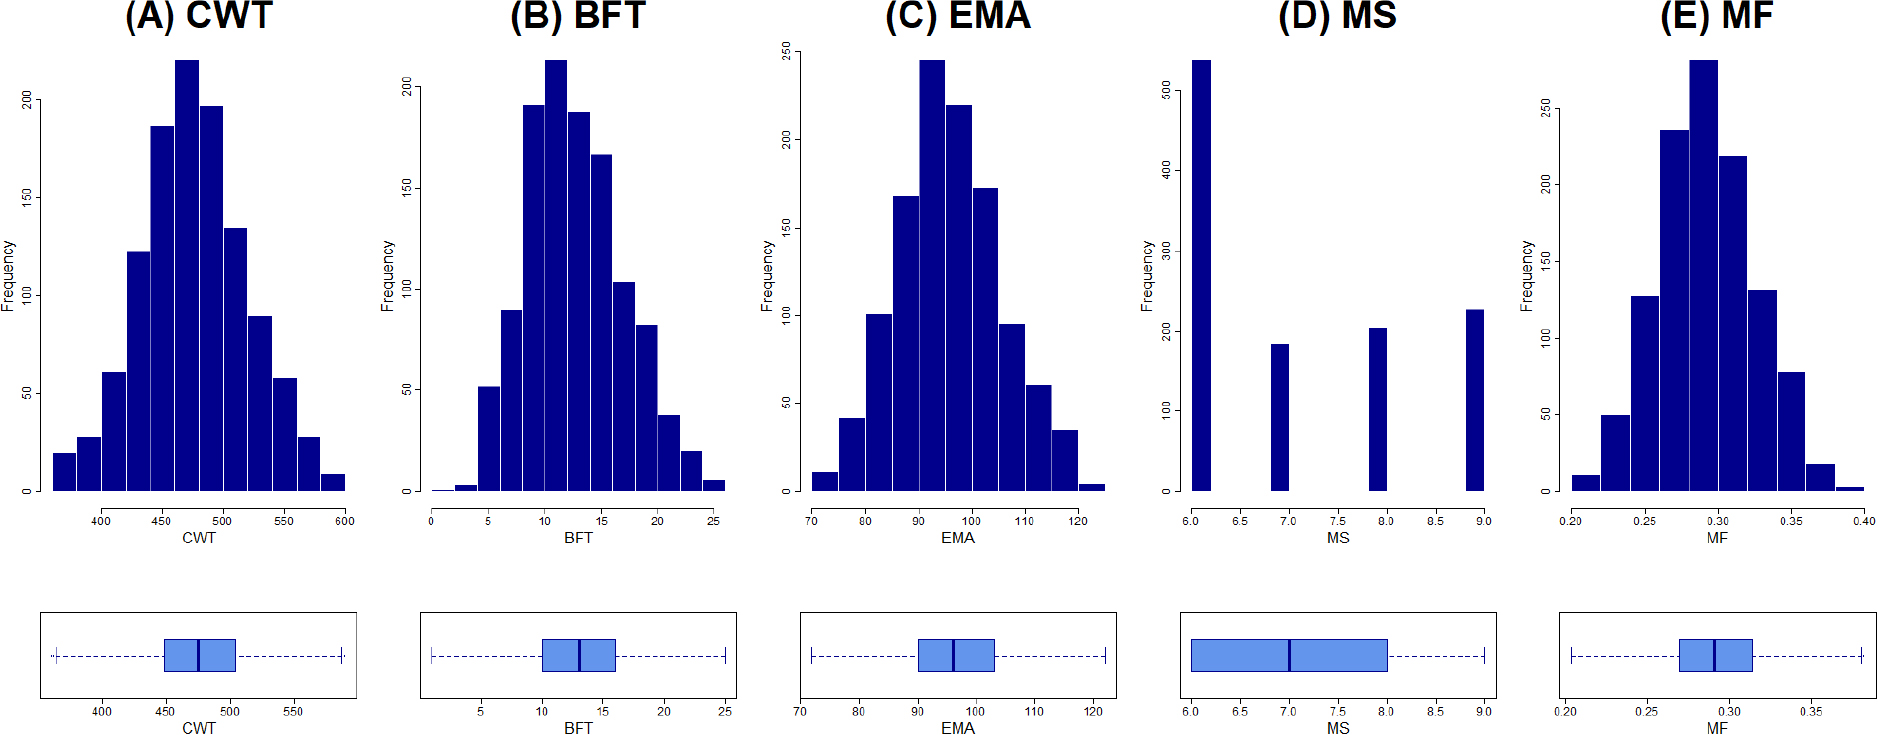
Descriptive statistics for CWT, BFT, EMA, MS, and MF are summarized in Table 1 and illustrated in Fig. 1. The average slaughter age of the steers analyzed was 995.1 ± 42.66 days (approximately 32.63 months). The means and standard deviations for the five traits were as follows: CWT, 476.17 ± 43.64 kg; BFT, 13.18 ± 4.24 mm; EMA, 96.25 ± 9.65 cm2; MS, 7.11 ± 1.19; and MF, 0.29 ± 0.03. Because the dataset was collected from a single slaughterhouse and included only highly marbled carcasses with MS grades 6 - 9, grade 6 occurred most frequently in the analyzed population.
Table 1.
Descriptive statistics for slaughter age, carcass traits, and MF in Hanwoo cattle.
| Trait | Mean | SD | Min | Max |
| Age (day) | 955.1 | 42.63 | 791 | 1,119 |
| CWT | 476.17 | 43.64 | 361 | 590 |
| BFT | 13.18 | 4.24 | 1 | 25 |
| EMA | 96.25 | 9.65 | 72 | 122 |
| MS | 7.11 | 1.19 | 6 | 9 |
| MF | 0.29 | 0.03 | 0.2 | 0.38 |
Estimates of phenotypic variance, additive genetic variance, and heritability for each trait are presented in Table 2. The heritability estimates were 0.55 for CWT, 0.435 for BFT, 0.472 for EMA, and 0.305 for MS, with the heritability of MF estimated at 0.441.
Table 2.
Heritability estimates for carcass traits and MF in Hanwoo cattle.
| Trait | Genetic (co)variance | Residual (co)variance | Heritability |
| CWT | 806.7 | 659.4 | 0.550 |
| BFT | 7.205 | 9.359 | 0.435 |
| EMA | 40.25 | 45 | 0.472 |
| MS | 0.421 | 0.960 | 0.305 |
| MF | 3.01E-04 | 3.82E-04 | 0.441 |
Genetic and phenotypic correlations among the five traits are shown in Table 3. Notably, MF showed strong genetic (0.639) and phenotypic (0.411) correlations with MS. Although MF exhibited a relatively high phenotypic correlation with EMA (0.428), its genetic correlation was low (0.198), suggesting a limited genetic association. Additionally, MS displayed moderate genetic correlations with CWT (0.243) and EMA (0.206), and a moderate phenotypic correlation of 0.411 with EMA.
Table 3.
Genetic and phenotypic correlations among slaughter age, carcass traits, and MF in Hanwoo cattle.
| Trait | CWT | BFT | EMA | MS | MF |
| CWT | 1.000 | 0.021 | 0.523 | 0.243 | 0.136 |
| BFT | 0.439 | 1.000 | -0.159 | 0.027 | -0.029 |
| EMA | 0.412 | 0.083 | 1.000 | 0.206 | 0.198 |
| MS | -0.013 | -0.002 | 0.411 | 1.000 | 0.639 |
| MF | 0.149 | 0.166 | 0.428 | 0.487 | 1.000 |
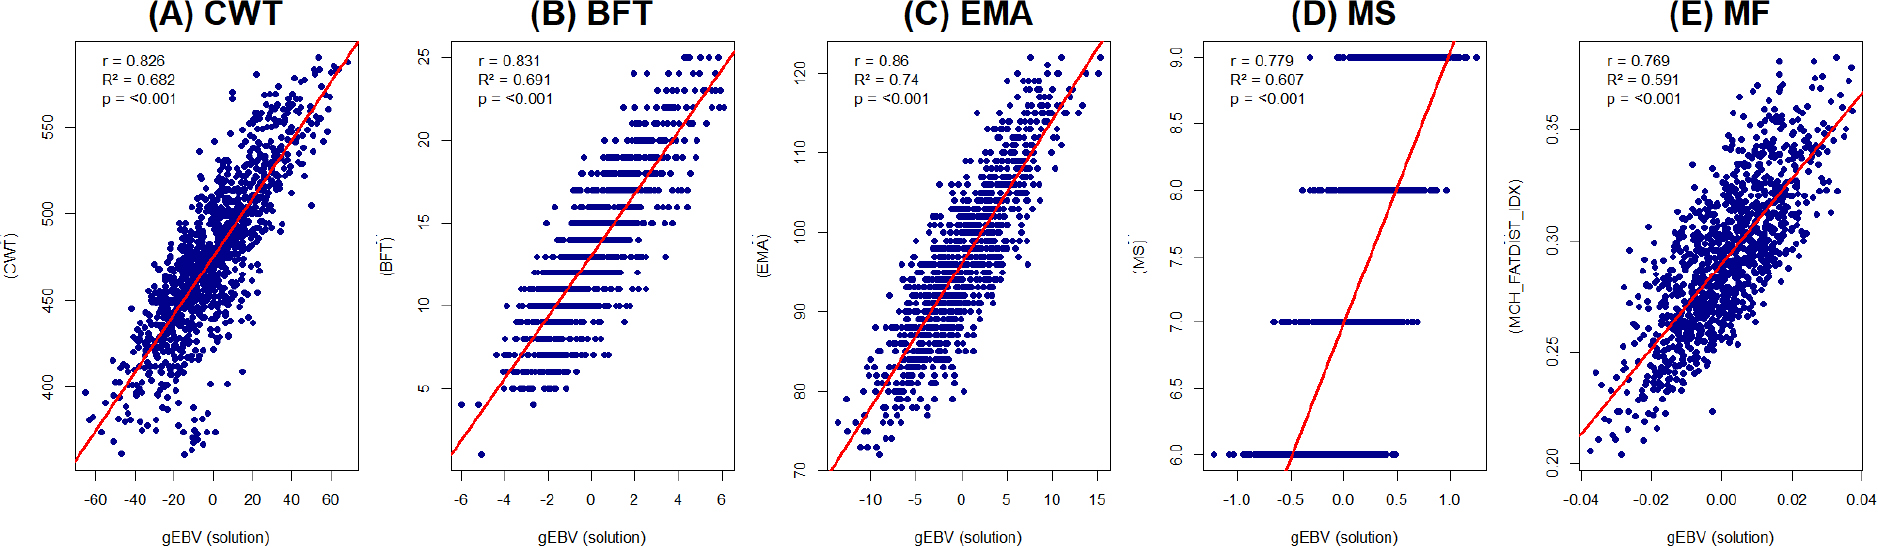
Correlation analyses between individual phenotypes and gEBVs revealed highly significant positive associations (p < 0.001) for all five traits (Table 4). The Pearson correlation coefficients (r) were 0.826 for CWT, 0.831 for BFT, 0.860 for EMA, 0.779 for MS, and 0.769 for MF. The corresponding coefficients of determination (R2) were 0.682, 0.691, 0.740, 0.607, and 0.591, respectively, indicating that gEBVs explained a substantial proportion of phenotypic variation in each trait (Table 4; Fig. 2).
Table 4.
Correlation between phenotypes and genomic estimated breeding values (gEBVs) in Hanwoo cattle.
| Trait | r | R2 | p-value |
| CWT | 0.826 | 0.682 | < 0.001 |
| BFT | 0.831 | 0.691 | < 0.001 |
| EMA | 0.860 | 0.740 | < 0.001 |
| MS | 0.779 | 0.607 | < 0.001 |
| MF | 0.769 | 0.591 | < 0.001 |
The average gEBV accuracies based on PEV were 0.781 (range: 0.457 - 0.821) for CWT, 0.715 (0.423 - 0.772) for BFT, 0.738 (0.435 - 0.789) for EMA, 0.652 (0.386 - 0.726) for MS, and 0.714 (0.423 - 0.771) for MF (Table 5).
Additionally, the mean realized accuracies derived from cross-validation were 0.471 for CWT, 0.298 for BFT, 0.539 for EMA, 0.467 for MS, and 0.498 for MF, indicating that BFT had the lowest realized accuracy among all traits (Table 5).
Table 5.
Prediction accuracies of genomic estimated breeding values (gEBVs) in Hanwoo cattle.
AccuracyPEV, theoretical accuracy based on prediction error variance (PEV); AccuracyCOR, realized accuracy based on the Pearson correlation between observed phenotypes (y) and predicted gEBVs (û); SD, standard deviation; Min, minimum; Max, maximum; CWT, carcass weight; BFT, back fat thickness; EMA, eye muscle area; MS, marbling score; MF, marbling fineness.
Discussion
During the phenotypic data collection period (November 2024 to April 2025), national averages of CWT, BFT, EMA, and MS in 9,354 Hanwoo steers were 480 kg, 12 mm, 104 cm2, and 7.0, respectively (KAPE, 2024). Compared to these values, the mean CWT in this study was similar, while BFT was slightly thicker and EMA was slightly smaller. The average MS of 7.1, was comparable to the national average. However, since the dataset was limited to steers with MS grades 6 - 9, the observed mean was somewhat lower than expected—likely due to a higher proportion of animals with MS grade 6 (Fig. 1).
The mean MF, calculated using the F7 index, was 0.29 ± 0.03. According to Lee et al. (2020), an F7 index ≤ 0.25 indicates finely and evenly distributed intramuscular fat, whereas an index ≥0.35 reflects coarse and clustered fat. Thus, the observed MF suggests that the steers in this study generally exhibited fine marbling distributions.
Heritability estimates for carcass traits in Hanwoo cattle have varied across studies. Srivastava et al. (2019) reported heritabilities of 0.39 for CWT, BFT, and EMA, and 0.46 for MS, while Alam et al. (2023) reported 0.42 for CWT, 0.36 for both BFT and EMA, and 0.47 for MS. In the present study, heritability ranged from 0.305 to 0.550, suggesting moderate to high genetic control. Although MS showed the lowest heritability among the traits, it was still higher than the 0.22 reported by Bhuiyan et al. (2017). The restricted MS grade range (grades 6 - 9) likely reduced phenotypic variance, contributing to the relatively lower heritability.
Kuchida et al. (2006) and Kuchida and Kanai (2012) defined MF traits using image analysis in Japanese Black cattle and conducted genetic evaluations. Kato et al. (2014) and Kohama et al. (2021) reported that the heritability of Kuchida’s fineness index was 0.395 and 0.490, respectively. In this study, MF showed moderate heritability (0.44), comparable to that of the four carcass traits, suggesting that genetic improvement of MF in Hanwoo cattle through image analysis is feasible. Further studies on correlations between MF and other carcass traits are recommended to effectively incorporate MF into breeding programs. Notably, the F7 index in the present study showed strong genetic and phenotypic correlations with MS (r > 0.4), suggesting shared genetic and environmental influences. Additional analysis is required to optimize selection efficiency and fully utilize MF as a new trait.
Previous attempts to apply Kuchida’s fineness index to Hanwoo were less successful in distinguishing MS levels (Lee et al., 2018; 2019; Beak et al., 2021), possibly due to differences in body frame size and carcass grading regions between breeds (Lee et al., 2025). Consequently, several studies have advocated for a Hanwoo-specific (Lee and Choi, 2019; Lee et al., 2019). The F7 index has proven effective at distinguishing fine versus coarse marbling groups in highly marbled Hanwoo steers (MS grades 6 - 9). The F7 index evaluates marbling uniformity and distribution by calculating the standard deviation of marbling area ratios across image tiles, with higher index values indicating coarser marbling. Therefore, the inverse relationship between the F7 index and MF should be carefully considered when integrating MF into breeding strategies, along with other carcass traits.
Kim et al. (2021) used GBLUP to estimate correlations between phenotypes and gEBVs in Hanwoo cattle and reported correlation coefficients of 0.673 for CWT, 0.454 for BFT, 0.526 for EMA, and 0.654 for MS. All traits, except BFT (p < 0.01), showed high significance (p < 0.001). These results contrast with the lower correlations (0.190 - 0.337) reported using pedigree-based PBLUP, confirming the enhanced accuracy of gEBVs for individual genetic merit estimation. The present study found strong positive correlations (r = 0.769 - 0.860) between phenotypes and gEBVs and substantial R2 values (0.591 - 0.740) across all five traits, confirming that GBLUP effectively predicted individual breeding values.
Recent studies evaluating gEBV accuracy in Hanwoo cattle using 50K SNP arrays have reported values of 0.68 - 0.74 (Haque et al., 2024), 0.66 - 0.78 (Lopez et al., 2020), and 0.744 - 0.788 (Kim et al., 2023). Kim et al. (2023) emphasized the role of reference population size for accuracy improvement. In this study, PEV-based accuracies ranged from 0.652 to 0.781, closely aligning with previous findings. Notably, MF exhibited comparable accuracy (0.714) to other carcass traits.
However, realized accuracies based on cross-validation correlations ranged from 0.471 to 0.539 for all traits except BFT. Jang et al. (2022) also reported accuracies (0.35 - 0.417) using cross-validation, with BFT being the lowest. Consistently, BFT in the present study showed notably lower realized accuracy (0.298), despite a high overall correlation (r = 0.831) and high PEV-based accuracy (0.715). This discrepancy suggests limited predictive performance of gEBVs for BFT in the validation set, potentially due to suboptimal GBLUP model fitting in test scenarios. Given that BFT is a discrete trait, small ranking shifts can significantly impact its correlation with actual phenotypes, underscoring the inherent limitations in applying a generalized model across all traits.
Haque et al. (2024; 2025) showed that weighted GBLUP, which assigns different SNP-specific weights, improves gEBV accuracy. Jang et al. (2022) employed deep learning methods to further improve genetic prediction accuracy. These efforts reflect ongoing advancements aimed at better capturing the genetic potential of individual animals.
In Hanwoo cattle, the national genetic evaluation system heavily relies on the reference population, which integrates phenotypic, pedigree, and genomic data. Annually, approximately 1,300 progeny-tested steers and 2,000 genotyped animals are added. Genomic data currently account for 95% of the weighting in the combined relationship matrix under single-step GBLUP (Lee et al., 2022). Therefore, to achieve accurate MF evaluation, it is crucial to expand the reference population by integrating nationwide phenotypes, pedigree records, and genomic information, as well as refine analytical models through improved characterization of environmental factors.
Conclusion
This study demonstrated that MF is a moderately heritable trait and shows a strong genetic correlation to MS. The significant correlation between MF and gEBVs, along with its predictive accuracy, suggests that MF can be enhanced through genetic selection. These findings indicate that MF can serve as a novel economic trait for quantifying intramuscular fat quality in Hanwoo cattle and may provide a foundation for developing genomic selection strategies aimed at enhancing beef quality.
