

Introduction
Materials and Methods
Sample preparation
NIR spectroscopy: System preparation and data acquisition
Data analysis
Results and Discussion
Spectral exploration
Model assessment
Challenge and limitations
Conclusion
Introduction
Somewhat Insects are one of the farmer’s enemies, as they could harm and negatively impact crop productivity (Hernanda et al., 2024). For instance, a stunted tea branch was found under natural circumstances due to the green leafhopper infestation (Gu et al., 2024). Furthermore, one study revealed that insect infestation decreased the color and chemical properties of sliced and dried hawthorn berries (Cheng et al., 2024).
It is worth noting that several insect species are considered to be edible. Despite the initial aversion to consuming insects, they are a rich source of nutrition, particularly protein, which is comparable to animal-based products and their derivatives (Ghosh et al., 2017). Furthermore, evidence suggests that edible insects have beneficial effects on the human body, such as anti-inflammatory and anti-cancer properties, due to the presence of bioactive compounds (Sánchez-Estrada et al., 2024). Ongoing research into edible insects as food sources has revealed various interesting findings, including the identification of bioactive peptides, as highlighted in a recent review (Rivero-Pino et al., 2024), as well as the extraction of lecithin from black soldier fly larvae and yellow mealworm (Li et al., 2024).
Since 2016, the Korean government, through the Ministry of Food and Drug Safety of Korea (MFDS), has allowed three species of edible insect, namely Tenebrio molitor, Allomyrina dichotoma, and Protaetia brevitarsis seulensis (PBS) as food materials, as reported in Lee et al. (2017). One of them, PBS, is a favorable edible insect species in the East Asia continent, including China, Japan, Taiwan, and the Republic of Korea, as well as in Europe (Lee et al., 2017). It had been chemically assessed that PBS owned the highest protein at the amount of 574.4 g·kg-1 dry weight after Oxya chinensis sinuosa (742.8 g·kg-1 dry weight) (Kim et al., 2017), compared to Tenebrio molitor (498 g·kg-1 dry weight), Bombyx mori (525.8 g·kg-1 dry weight), and Velarifictorus aspersus (463.1 g·kg-1 dry weight). In their study, the authors also revealed that PBS had distinct amounts of calcium, phosphorus, and magnesium, essential minerals for bone development. A recent study has successfully suggested the role of protein-rich PBS larvae as a good candidate for supplement cancer treatment (Song et al., 2023).
From our literature study above, PBS showed its benefits for the human body as a novel food. Hence, ensuring its quality and safety becomes mandatory to maintain consumer satisfaction. Usually, edible insects are available and consumed in three forms: whole-dried, as flour, or processed (Frigerio et al., 2020). Interestingly, edible insects are relatively more expensive than any agricultural products. Considering its high-cost protein source, low-cost protein sources, e.g., plant-based flour, might be added. It is similar to the addition of synthetic colorant in saffron (Raina et al., 2024), the spiking of almonds by peanut powder (Faqeerzada et al., 2020), the addition of melamine in pet food (Joshi et al., 2023), and many more.
The advanced biological assay was done by an earlier study, utilizing DNA information from edible insects to identify low-cost plant-based protein sources of adulteration (Frigerio et al., 2020). Other approaches, such as polymerase chain reaction (PCR), also apply to authentication, as demonstrated for medicinal herbs authentication (Chiou et al., 2007). From an analytical point of view, these evaluation techniques could be more useful for accuracy. However, these methods remain challenging as they do not provide rapid, require sample preparation, and are destructive. Thus, it is inapplicable for fast and real-time purposes, such as in food industries (Amanah et al., 2024).
Consequently, many researchers have been updating the feasibility of non-destructive technology for agriculture activities, pharmacies, the environment, and edible insects. Optical technology, such as spectroscopy, has attracted many scholars and researchers across multiple disciplines. When an incident electromagnetic wave hits any objects (i.e., food and agricultural products), it will be either reflected, absorbed, transmitted, or even scattered (Hernanda et al., 2023), which is captured by detector, signal processing, and presented as a spectrum. The variations of the spectrum are responsible for any chemical bonds inside the food and agricultural products matrix. Using this framework, rich chemical information—with no complex preparation—can be gained simultaneously and reasonably for favorableness as a non-destructive technique.
In the past study, near-infrared (NIR) and mid-infrared (MIR) spectroscopy were used to evaluate intact soybeans’ chemical composition (Amanah et al., 2020) and tuber flours (Masithoh et al., 2020, 2021). Furthermore, NIR hyperspectral imaging has also successfully quantified nicotine content in tobacco leaves (Divyanth et al., 2022a). In terms of adulteration, MIR spectroscopy is also applicable to detect the presence of melamine and cyanuric acid in pet food (Joshi et al., 2023), authentication of cinnamon powder (Yasmin et al., 2019), identification of lard in tuna oil (Windarsih et al., 2024), and quantification of wholegrain flour in cricket and buffalo worms (Foschi et al., 2022). Moreover, NIR spectroscopy had been promoted as non-destructive detection of pairwise adulteration in three edible insects, namely black soldier fly larvae, cricket, and mealworm (Ni et al., 2024), and adulterated seven edible insects with flour (Benes et al., 2022). A NIR spectral imaging technique was also applicable to measure the melamine content in milk powder (Lee et al., 2018; Kim et al., 2022b), benzoyl peroxide in wheat flour (Kim et al., 2022a), as well as Raman imaging to identify melamine in milk (Qin et al., 2017).
As listed above, vibrational spectroscopies are feasible for food quality and safety investigation. On behalf of its advancements, some vibrational spectroscopies, namely MIR and Raman spectroscopy have some limitations. For instance, as reported by Lohumi et al. (2015) in subsection 1.4 and section 2, MIR and Raman spectroscopies are capturing a tiny amount of the sample. Furthermore, a diamond crystal is usually attached to the instrument in MIR spectroscopy to provide an attenuated total reflectance (ATR). Consequently, it becomes more expensive—from an economic point of view—for the initial purchase (Lohumi et al., 2015). Raman spectroscopy is sensitive to the fluorescence effect, where further calculation, such as polynomial fit (Lee et al., 2013) is needed. Meanwhile, NIR spectroscopy could provide broad chemical information, especially biological samples. Therefore, NIR spectroscopy will be used in this study.
From those works and so far of our knowledge, a study on NIR spectroscopy for plant-based adulteration in PBS larvae powder is still restricted. The edible insect is still considered a new food, and the global demand for PBS remains. No issue has been reported on edible insect adulteration. Additionally, some plant-based materials, namely chickpea (Cicer arietinum) and soybean (Glycine max) are considered allergens in some countries and protein sources with low prices (Abu Risha et al., 2024). Considering these speculations, our study aims to investigate the feasibility of NIR spectroscopy in quantifying chickpea and soybean flour concentrations in PBS larvae powder. Two types of machine learning, namely partial least squares regression (PLSR) and Gaussian process regression (GPR), will be employed to realize the quantification.
Materials and Methods
Sample preparation
Dried PBS powder, chickpea, and soybean flour was purchased in an online store available in the Republic of Korea. To obtain a powdered sample, the dried PBS was ground by food grinder (Hanil mixer SHMF-4350S, Hanil Electric CS Co., Ltd., Korea) and sieved using a 425-micron sieve (Chung Gye Sang Gong Sa, Korea). To mimic the adulteration, chickpea powder was gradually added with 5% increments to the fine PBS powder in a 50 mL conical tube (Hyundai Micro Co., Ltd., Korea), resulting in 5.02 ± 0.03 grams. These two substances were mixed thoroughly for about 60 s using Vortex-Genie 2 high-speed vortex (Scientific Industries, Inc., USA). Notwithstanding, each chickpea concentration was created in triplicates. Prior to data acquisition, the mixed powder was transferred into a 30 mm diameter with a 10 mm depth cylindrical plastic sample plate. Similar procedures were also applied for soybean adulteration.
NIR spectroscopy: System preparation and data acquisition
Our sample’s spectral information was acquired using a lab-scale pointed-scan NIR spectrometer. The system of NIR spectroscopy comprises an indium gallium arsenide (InGaAs) detector (NIRQuest+2.5, Ocean Optics Inc., USA), which covered NIR bands from 890 to 2,510 nm with 3 nm spectral resolutions and equipped with 600-micron diameter of a fiber optics sensor probe from the same company. In addition, the sensor probe was placed 20 mm upon the sample surface with 45 degrees of direction. Furthermore, a 50 W halogen bulb (Decostar 51S, OSRAM GmbH, Germany) was also installed perpendicular to the sample at 14.50 cm distance. For the setting parameters, we set the integration time at 100 ms with 130 scans to average.
Moreover, we defined the boxcar width at “1.0” to smoothen the spectral intensity. Thus, the total time for one scan per sample was 13 s. Before spectral calibration, white and dark reference was performed using the white calibration standard (>99.99% reflectance), turned off the lamp, and covered the sensor probe. The entire system was operated through the OceanView software (version 2.0.14, Ocean Optics Inc., USA).
The prepared sample was then transferred under the fixed sensor probe to collect the NIR spectrum. Before data analysis, we collected ten spectra of each sample by performing the following protocols. First, we scanned the sample five times at different locations. Then, we gently mixed it with a spatula and scanned it five more times in various places. These aimed to obtain variative spectra from each sample. Noteworthy, we did not tap the sample to provide natural light penetration. Finally, a 320 spectral × 512 wavelengths matrix was obtained and organized in “.xlsx” file format.
We figured out a low signal-to-noise ratio (SNR) in a spectrum below 1,000 nm and higher than 2,400 nm (data not shown); therefore, these spectral positions at those regions were excluded. Furthermore, a sample with an abnormal spectra intensity, indicated by higher than one and lower than 0, was removed; to that, a final matrix of 317 spectral × 442 wavelengths (PBS + chickpea) and 319 spectral × 442 wavelengths (PBS + soybean) was used instead. Moreover, the spectrum was converted to “Log(1/R)” to develop the model (Rahmawati et al., 2023).
Data analysis
To develop the model, each adulterated group was divided into calibration and prediction with a 7 : 3 ratio (Amanah et al., 2024). Next, prior to model calibration, two types of spectral pretreatment, namely, standard normal variate (SNV) and the Savitzky-Golay first derivative (third order and five window size) were used to reduce and remove the abnormalities due to the morphological characteristics of the powder (Baek et al., 2019) and scattering effect from the light (Hernanda et al., 2023), as well as baseline removal (Rinnan et al., 2009). Afterward, to optimize the performance of NIR spectroscopy in quantifying plant-based flours in PBS powder, we utilized chemometric approaches, which will be detailed in the following paragraphs.
PLSR is a well-known chemometric approach widely implemented in spectroscopy-related studies. The major concept of PLSR is compressing the high-dimensional matrix into a few new important variable factors. In PLSR, it was assumed that the spectral data (X) had strong linearity with the adulterant concentrations (i.e., chickpea and soybean flours). Therefore, the bilinear equation of PLSR is written below (Eqs. (1), (2), (3)).
As we notice in Eq. (1), it is similar to the principal component analysis (PCA), where variables could be constructed from the score () and loading () values. Nonetheless, in PLSR, the adulterant concentration () was also composed of score () and loading () values, while the main model () was mathematically calculated from those new variables. Finally, the prediction equation of the PLSR model can be written as follows (Eq. (4)).
where, is the predicted value (%) and is the intercept.
Besides the PLSR method, we also employed a non-linear chemometric approach, called GPR, which belongs to the Bayesian family (Pullanagari and Li, 2020). Given a spectral data and adulterant concentrations , a regression analysis was performed, as mathematically described in previous studies (Beć et al., 2021; Chen et al., 2023). Considering the Bayesian framework, it was firstly initialized with zero mean ( = 0) and covariance functions (). The covariance will describe the characteristic of the to the by the geometrical distance (Pullanagari and Li, 2020; Chen et al., 2023). The GPR model is described in Eqs. (5) and (6), respectively.
Regarding the covariance function, an automatic relevance determination (ARD) squared exponential was used (Eq. (6)). The required two hyperparameters (i.e., and ) which are necessarily optimized by preparing an initial vector in logarithmic space. The optimization was done by minimizing the negative log marginal likelihood (NLML), which is slightly different from other techniques, such as PLSR (in this study), deep learning (Divyanth et al., 2022b; Putra et al., 2022; Yu et al., 2023), artificial neural networks (Pareek et al., 2023), and so on. Furthermore, an inference method, expectation propagation (EP), was used.
To evaluate each model performance, a coefficient of determination (R2) was used to assess whether the actual concentration and predicted concentration (i.e., using PLSR and GPR) have a strong linear relationship, wherein the values range from 0 to 1. We also calculated root mean squares error (RMSE) to evaluate the error between the actual and predicted values. The RMSE has no range; otherwise, the higher RMSE indicates a high error among actual and predicted concentrations. Furthermore, to classify the model into a successful, moderate, and inapplicable model, the ratio of prediction to deviation (RPD) value was also considered (Nie et al., 2009).
All computations mentioned in this study were executed and adjusted in MATLAB software (version R2023b; The MathWorks, USA). In addition, the GPR model was developed using GPML Toolbox (version 4.2) run in MATLAB software (Rasmussen and Nickisch, 2010).
Results and Discussion
Spectral exploration
The averaged spectra of pure and adulterated PBS are depicted in Fig. 1. According to Fig. 1A, the three groups of samples exhibit similar NIR patterns within the waveband ranging from 1,000 to 2,400 nm. Moreover, chickpea and soybean flour, as adulterants, showed a lower absorbance than PBS powder. It indicates that PBS is relatively darker than the adulterant materials, as it reflects less light. The distinct differences between the pure and adulterant were mainly caused by nature’s characteristics, for instance, insect and plant-based material. A similar case was also found, where different NIR intensities were observed between wheat and edible insect flour (Benes et al., 2022). Meanwhile, Fig. 1B and C show the different absorbance intensities from the pure PBS powder and contaminated PBS with various adulterant concentrations.
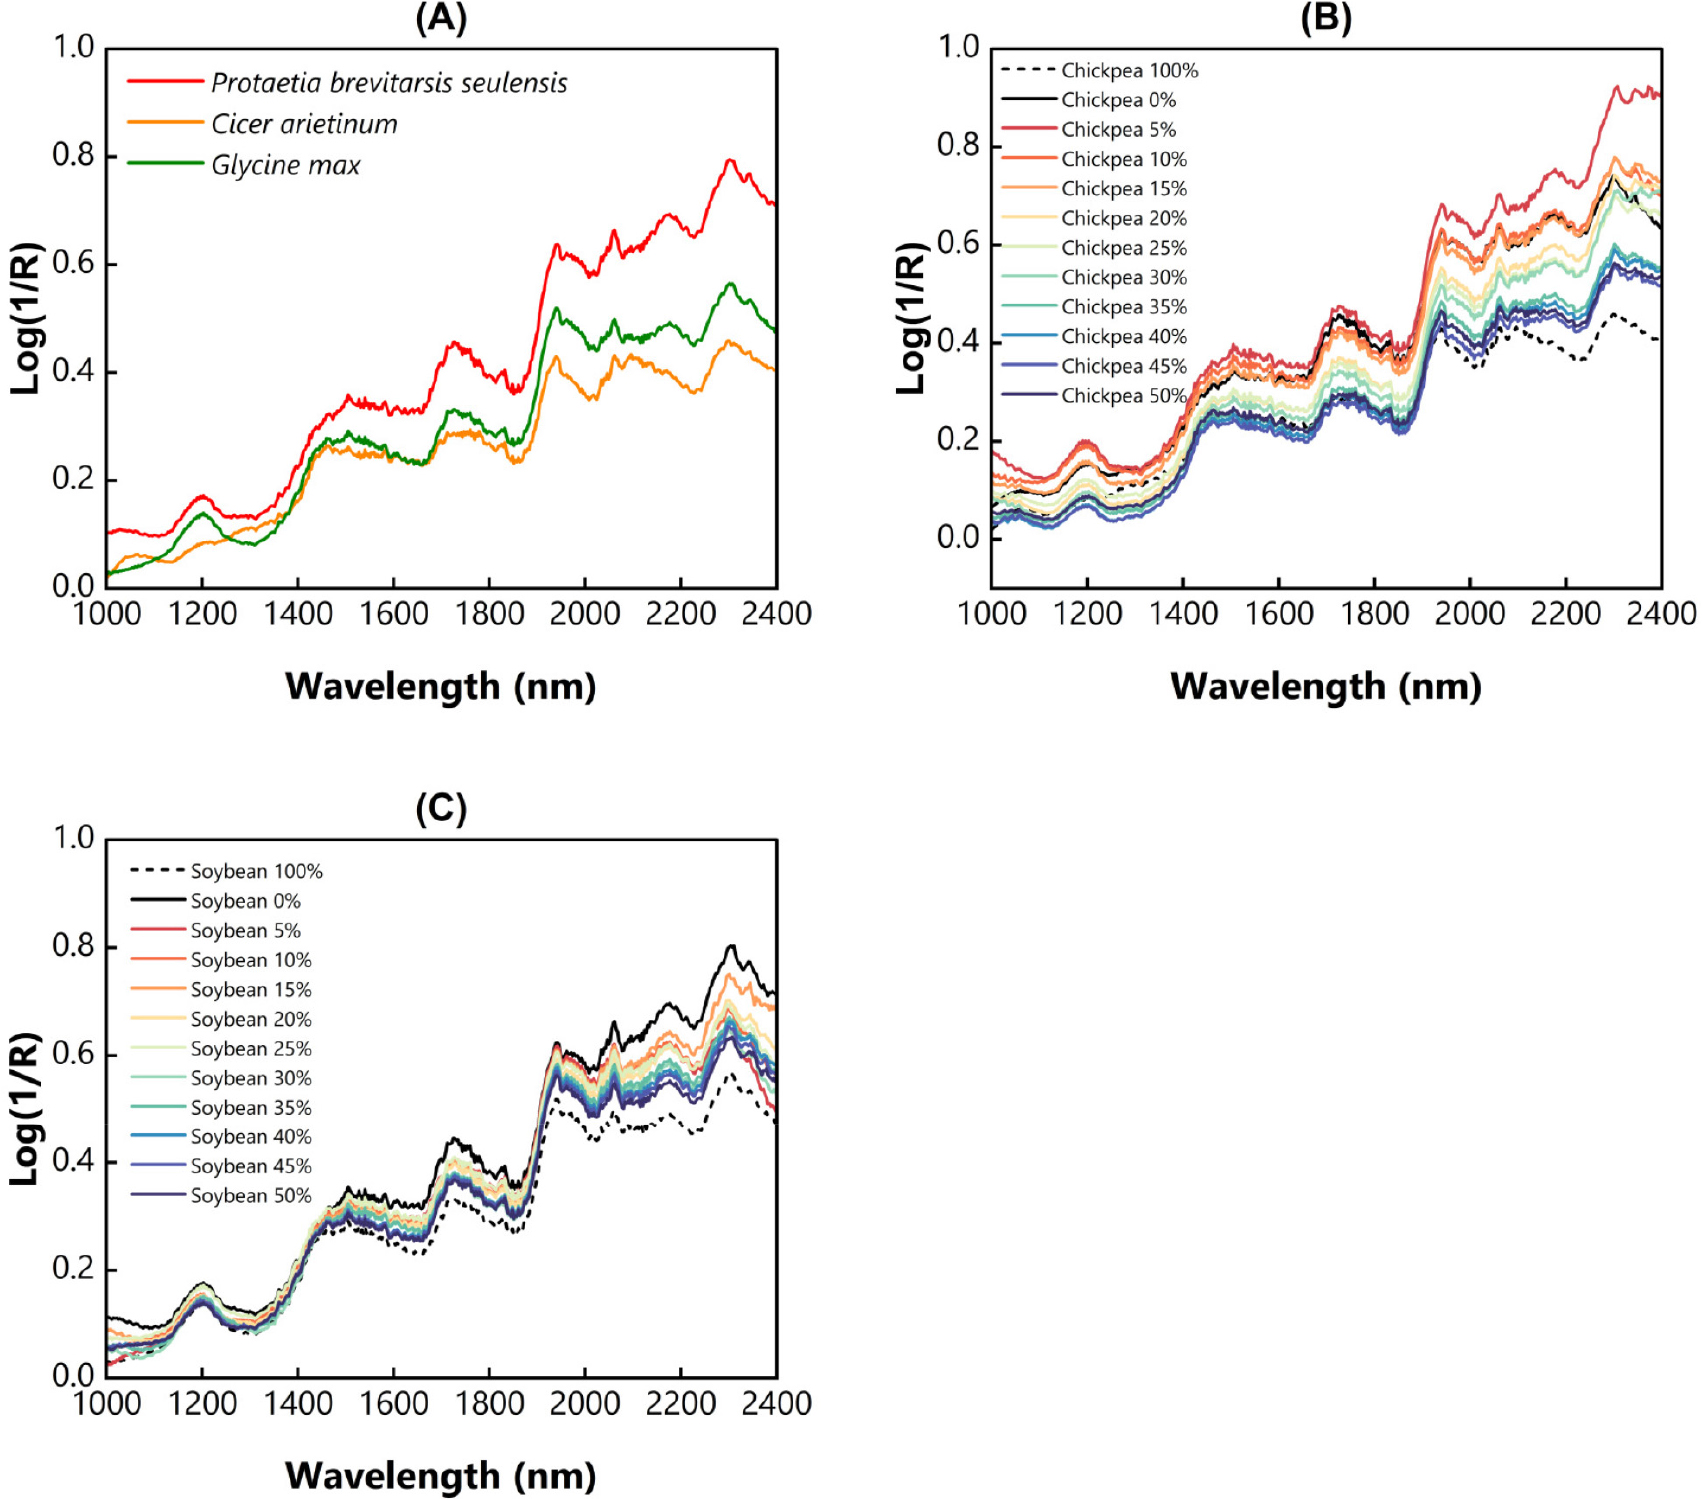
Different concentrations of adulterant resulting in different spectral intensities; for instance, PBS with higher adulterant concentration would tend to have a low absorbance value, and vice versa. The gradient of spectra intensity was observed at a wavelength higher than 1,400 nm, where protein and fat molecules were detected in this region (Benes et al., 2022). For instance, a region within 1,505 - 1,731 nm was associated with stretching molecules of N-H, O-H, and C-H first overtone, identical to protein, carbohydrate, and fat (Beć et al., 2020). In this region, several amino acids, such as tryptophan, tyrosine, and phenylalanine can be detected, as they contain N-H molecules (Benes et al., 2022). A clear spectral difference from each adulterant concentration was also discovered in 1,857 to 1,945 nm, related to C-H and O-H stretching in carbohydrate molecules. A wavelength located at 1,950 nm may also be related to the protein molecules, cited elsewhere (Kröncke et al., 2023). Finally, the absorption of amide, C=O first overtone, and C-H combination can be detected in regions within 1,950 - 2,400 nm (Beć et al., 2020; Ni et al., 2024).
The presence of soybean and chickpea flour may cause the different spectra intensity in those regions, as a consequence of chemical alterations. Obviously, our study is similar to the previous work. For instance, the addition of pork oil gradually decreased the tuna oil absorbance intensity, observed in the MIR region (600 - 1,800 cm-1) (Windarsih et al., 2024). Net analyte vectors derived from Raman spectroscopy clearly illustrated the effect of olive oil adulteration on argan oil (Joshi et al., 2019). Benes et al. (2022) revealed that the addition of wheat flour could increase the reflectance of the Acheta domesticus investigated in the NIR region. Additionally, we do not have any chemical information about each sample, such as their proximate or phytochemical properties, as we only consider the percent concentration based on adulterant weight. Thus, further chemical assessment of the pure and adulterated samples could be performed, such that an in-depth investigation could be provided in future efforts.
Model assessment
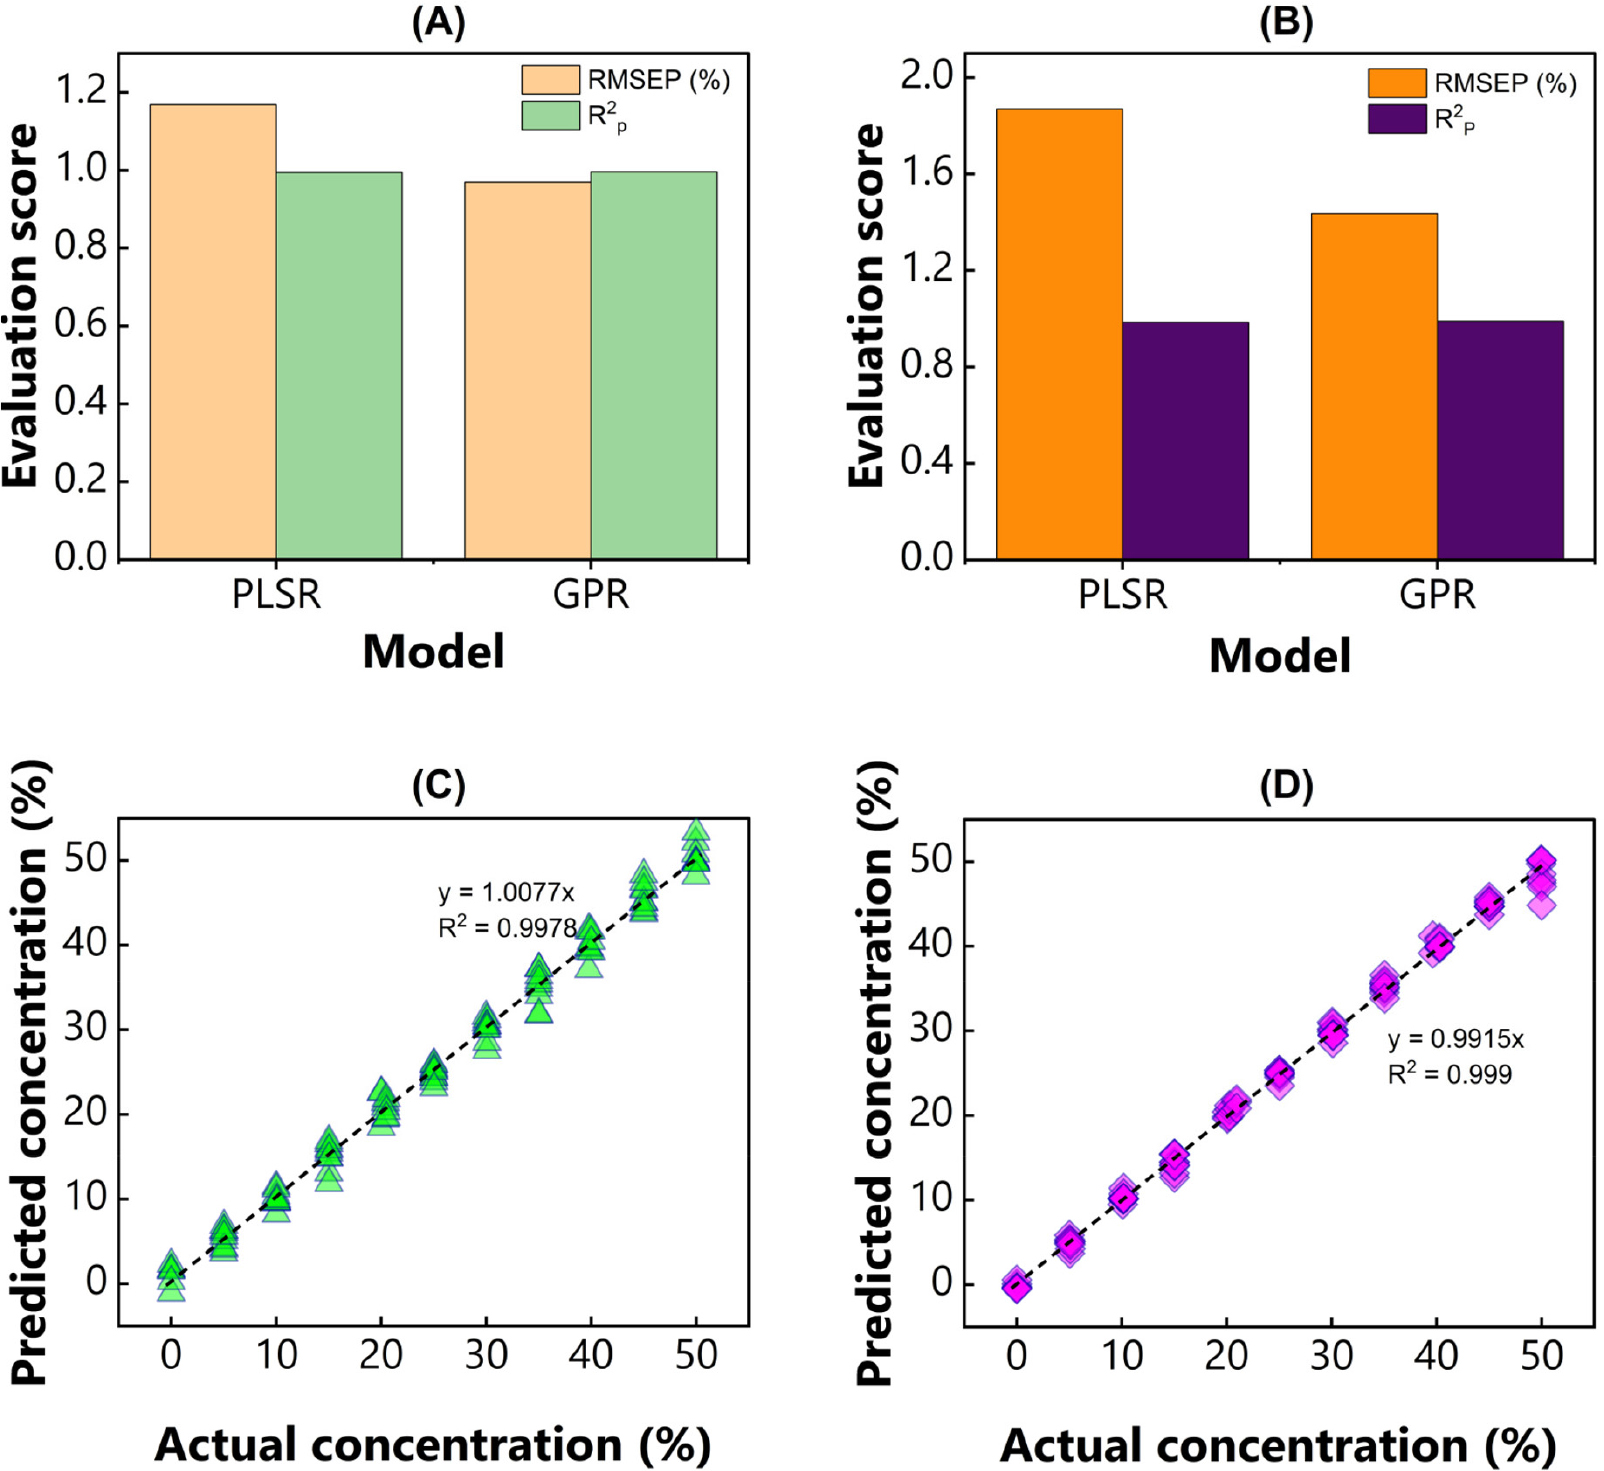
Table 1 lists the evaluation metric of our proposed model in predicting chickpea and soybean flour in PBS powder. This study examined two spectral pretreatments and the original NIR spectrum on each chemometrics. Satisfaction results were observed in the calibration group, indicated by R2c over 0.990, consistent with the previous experiment (Kim et al., 2022b), and better than the PLSR model for predicting cucumber powdery mildew using NIR and fluorescence spectroscopy (Gao et al., 2023; Xu et al., 2023). Meanwhile, the root mean squared error of calibration (RMSEC) ranged from 0 to 1.535%w/w generated from PLSR and GPR.
In comparison, results similar to those of root mean squared error of prediction (RMSEP) were exhibited in the PLSR (1.169 to 2.515%w/w) and GPR (0.97 to 2.263%w/w). The optimum PLSR model was achieved by spectra treated with SNV with R2p of 0.994, RMSEP of 1.169%w/w, and RPD of 13.252 in predicting chickpea flour. The best PLSR model for estimating soybean flour was developed using original spectra, resulting in an R2p of 0.985, RMSEP of 1.87%w/w, and RPD of 8.271. In contrast, among spectra pretreatment techniques, original NIR spectra have satisfactory results in predicting chickpea (RMSEP of 0.97%w/w) and soybean (RMSEP of 1.584%w/w) concentration by the GPR model. Additionally, all proposed models presented in this study showed a successful prediction, supported by RPD values higher than 3 (Nie et al., 2009).
Table 1.
Model evaluation in predicting chickpea and soybean level concentration.
D.M., detection model; R2c, coefficient of determination of calibration; RMSEC, root mean squared error of calibration; R2p, coefficient of determination of prediction; RMSEP, root mean squared error of prediction; RPD, ratio of prediction to deviation; PLSR, partial least squares regression; GPR, Gaussian process regression; SNV, standard normal variate; SG1, Savitsky-Golay first derivative.
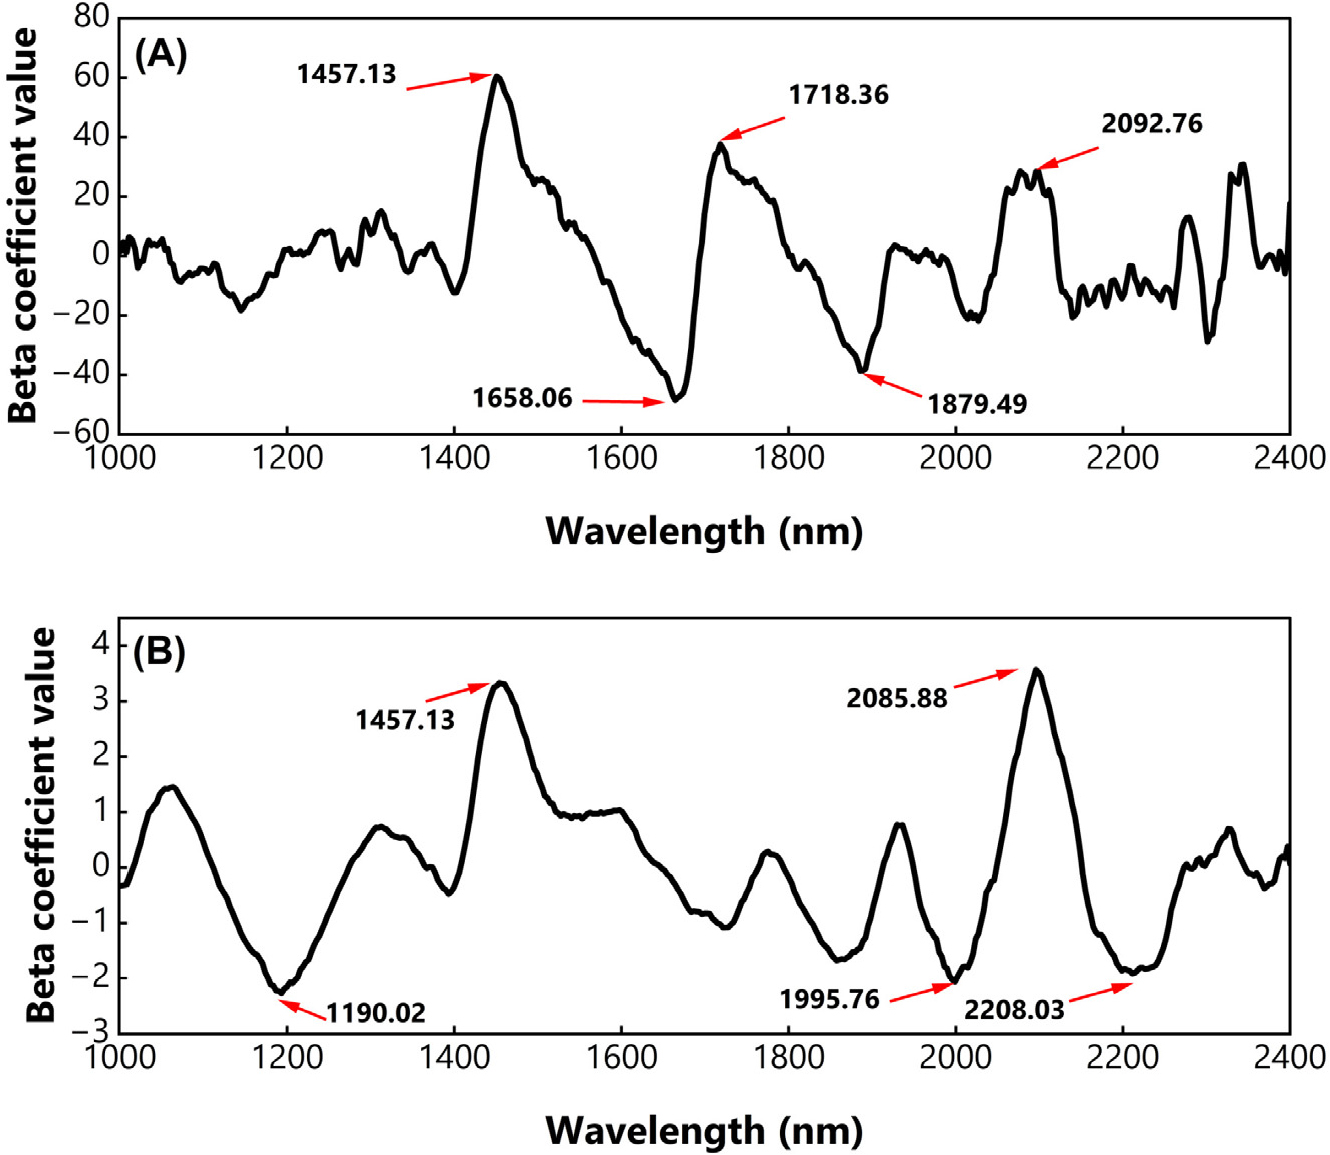
In terms of PLSR, the beta coefficient value identifies the most contributing variable (i.e., wavelength) in predicting chickpea and soybean powder. Fig. 2 depicts the plot of the beta coefficient from the optimum PLSR model in predicting adulterant concentration in PBS powder. Five distinct peaks were observable and considered as the most contributing wavelengths, for detecting both adulterant materials. For instance, 1,190.02 nm, 1,457.13 nm, 1,995.76 nm, 2,085.88 nm, and 2,208.03 nm were noticeable in chickpea detection (Fig. 2A), while 1,457.13 nm, 1,658.06 nm, 1,718.36 nm, 1,879.49 nm, and 2,092.76 nm were found in soybean detection (Fig. 2B). Those positioned wavelengths linked to the C-H first overtone, found in the CH2 molecule (Aulia et al., 2022), O-H, and N-H bonds, which are common for organic components (Saha et al., 2023). For chickpea detection, we discovered a distinct valley appeared at 1,190.02 nm, which was not found in soybeans. This mentioned wavelength has also been noticed in Saha et al. (2023), which is identical to the C-H stretch due to carbohydrate molecules. Furthermore, peaks appeared in 2,083 to 2,222 nm corresponding with linoleic acid and α-linoleic acid in soybean oil, cited elsewhere (Pereira et al., 2019). In addition, the presence of peaks located at 2,085 to 2,208 nm is related to the starch in soybean (Amanah et al., 2022).
The chemical bonds found in edible insects, while similar to typical chemical bonds (Kim et al., 2023; Ni et al., 2024), may exhibit unique properties not present in plant-based materials, such as cellulose, amino acids, and fatty acids. Similarly, the C-H stretch characteristics in edible insects could differ from those in oils, seeds, and other agricultural products, as cited elsewhere (Aulia et al., 2022). To that, it is logical to assume that the same C-H bonds in edible insects will also differ.
The summary of the optimal model is depicted in Fig. 3. Among the constructed models, GPR showed considerably better results than PLSR. In other words, GPR improved the model’s quality in predicting chickpea and soybean flour. Although the coefficient of determination extracted from those models was relatively similar, a significant RMSEP was observed. Fig. 3 demonstrates that GPR generated a lower error than PLSR. Fig. 3 shows that GPR generated a lower error than the error yielded by PLSR. Our study aligns with previous research. For example, scholars (Pullanagari and Li, 2020) showed model improvement by GPR in predicting total soluble solids (TSS) and firmness of cherry fruit using NIR hyperspectral imaging. GPR yielded lower RMSEP (0.43% and 0.38 N) than PLSR (0.64% and 0.44 N). Another study also found that GPR could provide high accuracy in predicting protein of intact handmade buffalo worm fitness bar with an RMSEP of 0.517%, and a powdered bar with an RMSEP of 0.295% by using fused NIR sensor (Tellspec [Tellspec Inc., Canada] + SCiO [Consumer Physics, Israel]) (Beć et al., 2021). Similarly, an outstanding result indicated that GPR, assisted by Vis/NIR spectroscopy, generated a fitting error of 3.9% in quantifying the brix value of two grape varieties, French Colombard and Cabernet (Ebrahimi et al., 2024).
Challenge and limitations
The advancement of NIR spectroscopy in quantifying the adulterant levels in PBS powder has been investigated in this current study. However, although the first section of this manuscript has detailed evidence of using NIR spectroscopy, it still shows the challenges and limitations. First, the use of NIR spectroscopy is restricted to the scanning method, that is, pointed scan. Repeated measurements are necessarily carried out to ensure the repeatability of the model and instrument. Second, NIR spectroscopy seems inapplicable for continuous processes, such as in belt conveyors (Amanah et al., 2024). Thereto, hyperspectral imaging, as the advanced technique of spectroscopy, comprising spatial and spectral information can be explored to address these problems (Hernanda et al., 2023). In the case of our experiments, biochemical assays, such as chromatography, PCR, etc., could be provided to support spectral exploration, as spectroscopy is a secondary analytic (Lohumi et al., 2015) and an untargeted instrument. A wavelength selection technique is also possible to carry out to decrease the computational task, as well as remove the effect of multicollinearity among the wavelengths.
Conclusion
Spectral analysis for adulterant level detection in PBS powder in tandem with NIR spectroscopy has been examined. NIR spectrum ranging from 1,000 to 2,400 nm has been used to construct prediction models with PLSR and GPR approaches. This study demonstrated that both methods yielded an outstanding performance, indicated by R2p ≥ 0.973 and RPD higher than 3. Among the two models, GPR with original spectra improved by decreasing RMSEP value (0.97%w/w for the chickpea detection model and 1.584%w/w for the soybean detection model). Thus, NIR spectroscopy combined with the GPR model showed good potential for a rapid and nondestructive tool in quantifying chickpea and soybean content in PBS powder.
