

Introduction
Materials and Methods
Experimental setup and data collection
Data preprocessing
Macro-noise removal
Micro-noise isolation
Morphological traits extraction
Height and width measurement
Diameter measurement
Evaluation of extracted traits
Results and Discussion
Data preprocessing
Phenotypic traits measurements
Conclusion
Introduction
Modern plant phenomics focuses on the accurate measurement of qualitative and quantitative traits that define a plant phenotype (Crossa et al., 2021). These traits are critical for breeders in assessing genotype performance and for farmers in implementing precision crop management strategies. Traditional methods of measuring plant traits were predominantly manual, labor-intensive, and time-consuming (Li et al., 2020). However, recent advancements in digital imaging and scanning technologies have significantly enhanced the throughput and accuracy of phenotyping (Van der Meij et al., 2017; Benelli et al., 2020).
Light detection and ranging (LiDAR) has emerged as a powerful tool in plant phenotyping, particularly in field conditions where accurate three-dimensional (3D) data is crucial (Zhu et al., 2021; Tao et al., 2022). Unlike passive imaging systems, LiDAR actively emits laser pulses towards a target and measures the time taken for the pulses to return. This time-of-flight information allows for the creation of high-resolution 3D point clouds, capturing detailed spatial features of crops, including height, canopy structure, and biomass. The precision and depth of information provided by LiDAR make it uniquely suited to overcome some of the inherent challenges in field-based phenotyping.
Despite these advancements, real-field conditions present unique challenges for plant phenotyping, particularly when using 3D point cloud data. Field environments are complex, with factors such as overlapping plants, occlusion, and uneven terrain, making it difficult to capture and analyze accurate phenotypic data. While LiDAR technology has emerged as a promising tool for acquiring detailed 3D information about plant structure and morphology, its application in real-field conditions remains limited by these complexities. These challenges complicate the extraction of accurate phenotypic traits from the raw LiDAR data. Moreover, the large volume of point cloud data generated in these settings can be computationally demanding, requiring advanced processing techniques and robust hardware to manage effectively.
Furthermore, accurate segmentation of plant organs in LiDAR-derived point clouds is crucial for effective phenotyping but is challenged by complex field environments. Traditional methods, relying on hand-crafted features (Rusu, 2010), often fail in scenarios with intricate plant structures and overlapping parts, leading to measurement errors (Patel et al., 2023). Recent advancements in 3D deep learning offer promising solutions, enabling more accurate and generalizable segmentation through automated feature extraction from large datasets (Boogaard et al., 2023; Guo et al., 2023; Ma et al., 2023; Meyer et al., 2023; Sun et al., 2023; Zhang et al., 2023). However, challenges such as dense plant overlap, self-occlusion, and the computational demands of large point clouds persist, complicating precise segmentation in real-field conditions as highlighted by Patel et al. (2023).
To address the challenges of dense plant overlap, self-occlusion, and computational demands in field phenotyping, a custom user interface (UI) was developed for human-aided phenotyping. While advanced algorithm has made significant strides, human operators still excel at identifying key areas within point clouds, even in complex field conditions. By leveraging this expertise, the user-friendly interface enhances the accuracy and efficiency of phenotypic data extraction, facilitating more reliable plant organ identification under challenging conditions.
Therefore, the main objective of this study aims to explore the potential of human aided 3D point cloud analysis for phenotyping crop under near real-field conditions using a custom-built desktop application. The focus was on measurable traits such as plant height, panicle height, stem diameter, and crown diameter, evaluating their accuracy and significance in breeding and plant phenotyping.
For clarify, in this study near real-field phenotyping shall refer to phenotyping conducted in controlled growth environments, like plant factories and/or experimental greenhouses where plants are planted under optimal production recommendations such as within-row and inter-row spacing to maximize yield. The key distinction with real-field phenotyping lies in the environmental variability and their flexibility regarding the movement or rotation of individual plants or plant groups. Near real-field environments allow more environment control and greater flexibility, as plants are often grown in pots that can be easily repositioned. In contrast, real-field, where crops are typically planted directly in the soil or in fixed large platforms, restrict movement, making it impossible to manipulate individual plants alongside natural interplay in environmental variables. However, if plants are deliberately spaced to facilitate easy data collection at the expense of yield, they are not classified under near real-field phenotyping regardless of where they are planted. Understanding these distinctions is crucial, as planting density and pattern can significantly impact the range of measurable phenotypic traits and the design of analytical algorithms.
Materials and Methods
Experimental setup and data collection
For this experiment, sorghum and soybean plants were selected to represent two broad categories of crops: narrow-leaf and broad-leaf, respectively. To closely mimic real field planting patterns, each crop was planted in two rows with 50 cm inter-row spacing and 30 cm inter-plant spacing, totaling 40 plants per crop type.
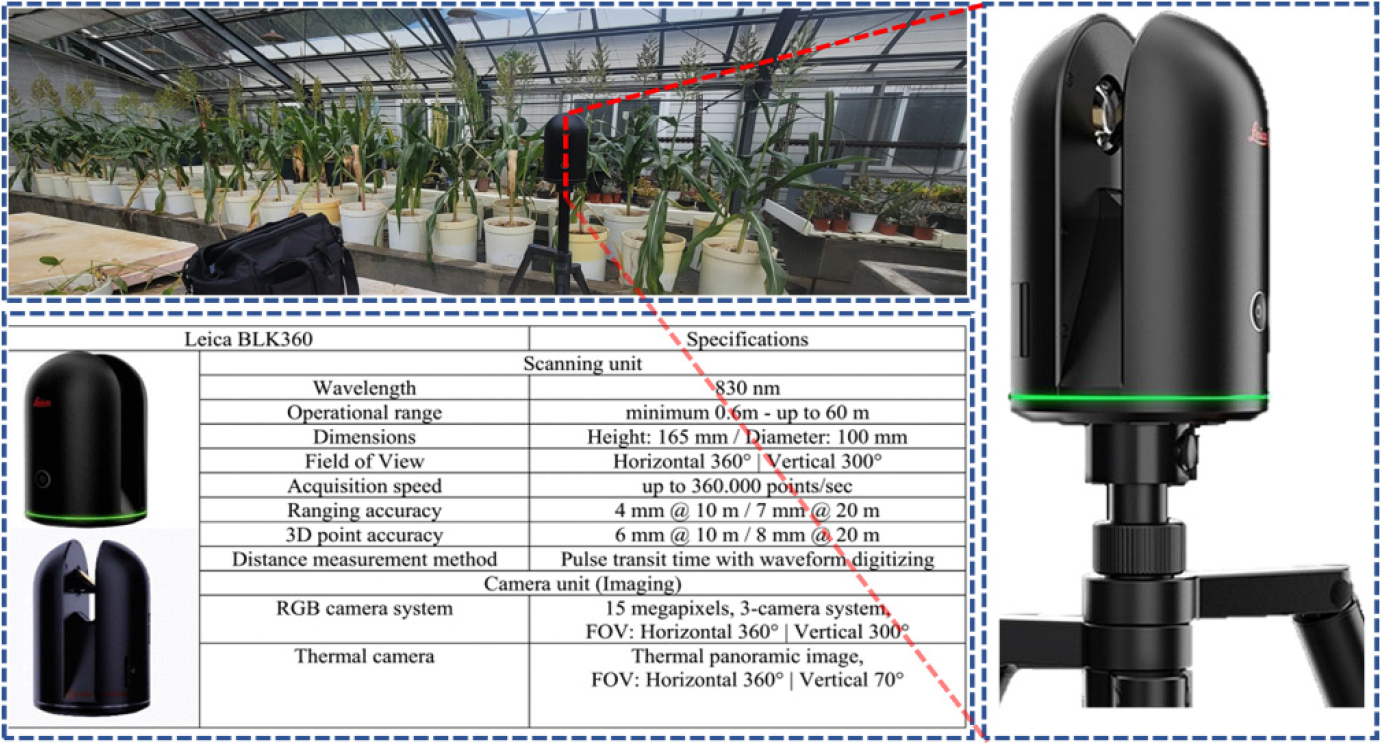
Data collection for sorghum plants commenced in the fourth week after planting and was conducted weekly for 10 weeks. Similarly, data collection for soybean plants began in the fourth week and continued weekly for 8 weeks. All data were collected using a Leica BLK360 precision imaging laser scanner (Leica Geosystems, Switzerland; Fig. 1). The sensor was consistently positioned approximately 1 meter away from the planting row and about 20 cm above the plants. Scans were captured under daylight conditions to ensure reliable RGB data for point cloud visualization. Ground truth data included measurements of various heights (total plant height, sorghum panicle height) and diameters (stem diameter, sorghum crown diameter), obtained using a calibrated ruler and caliper.
Data preprocessing
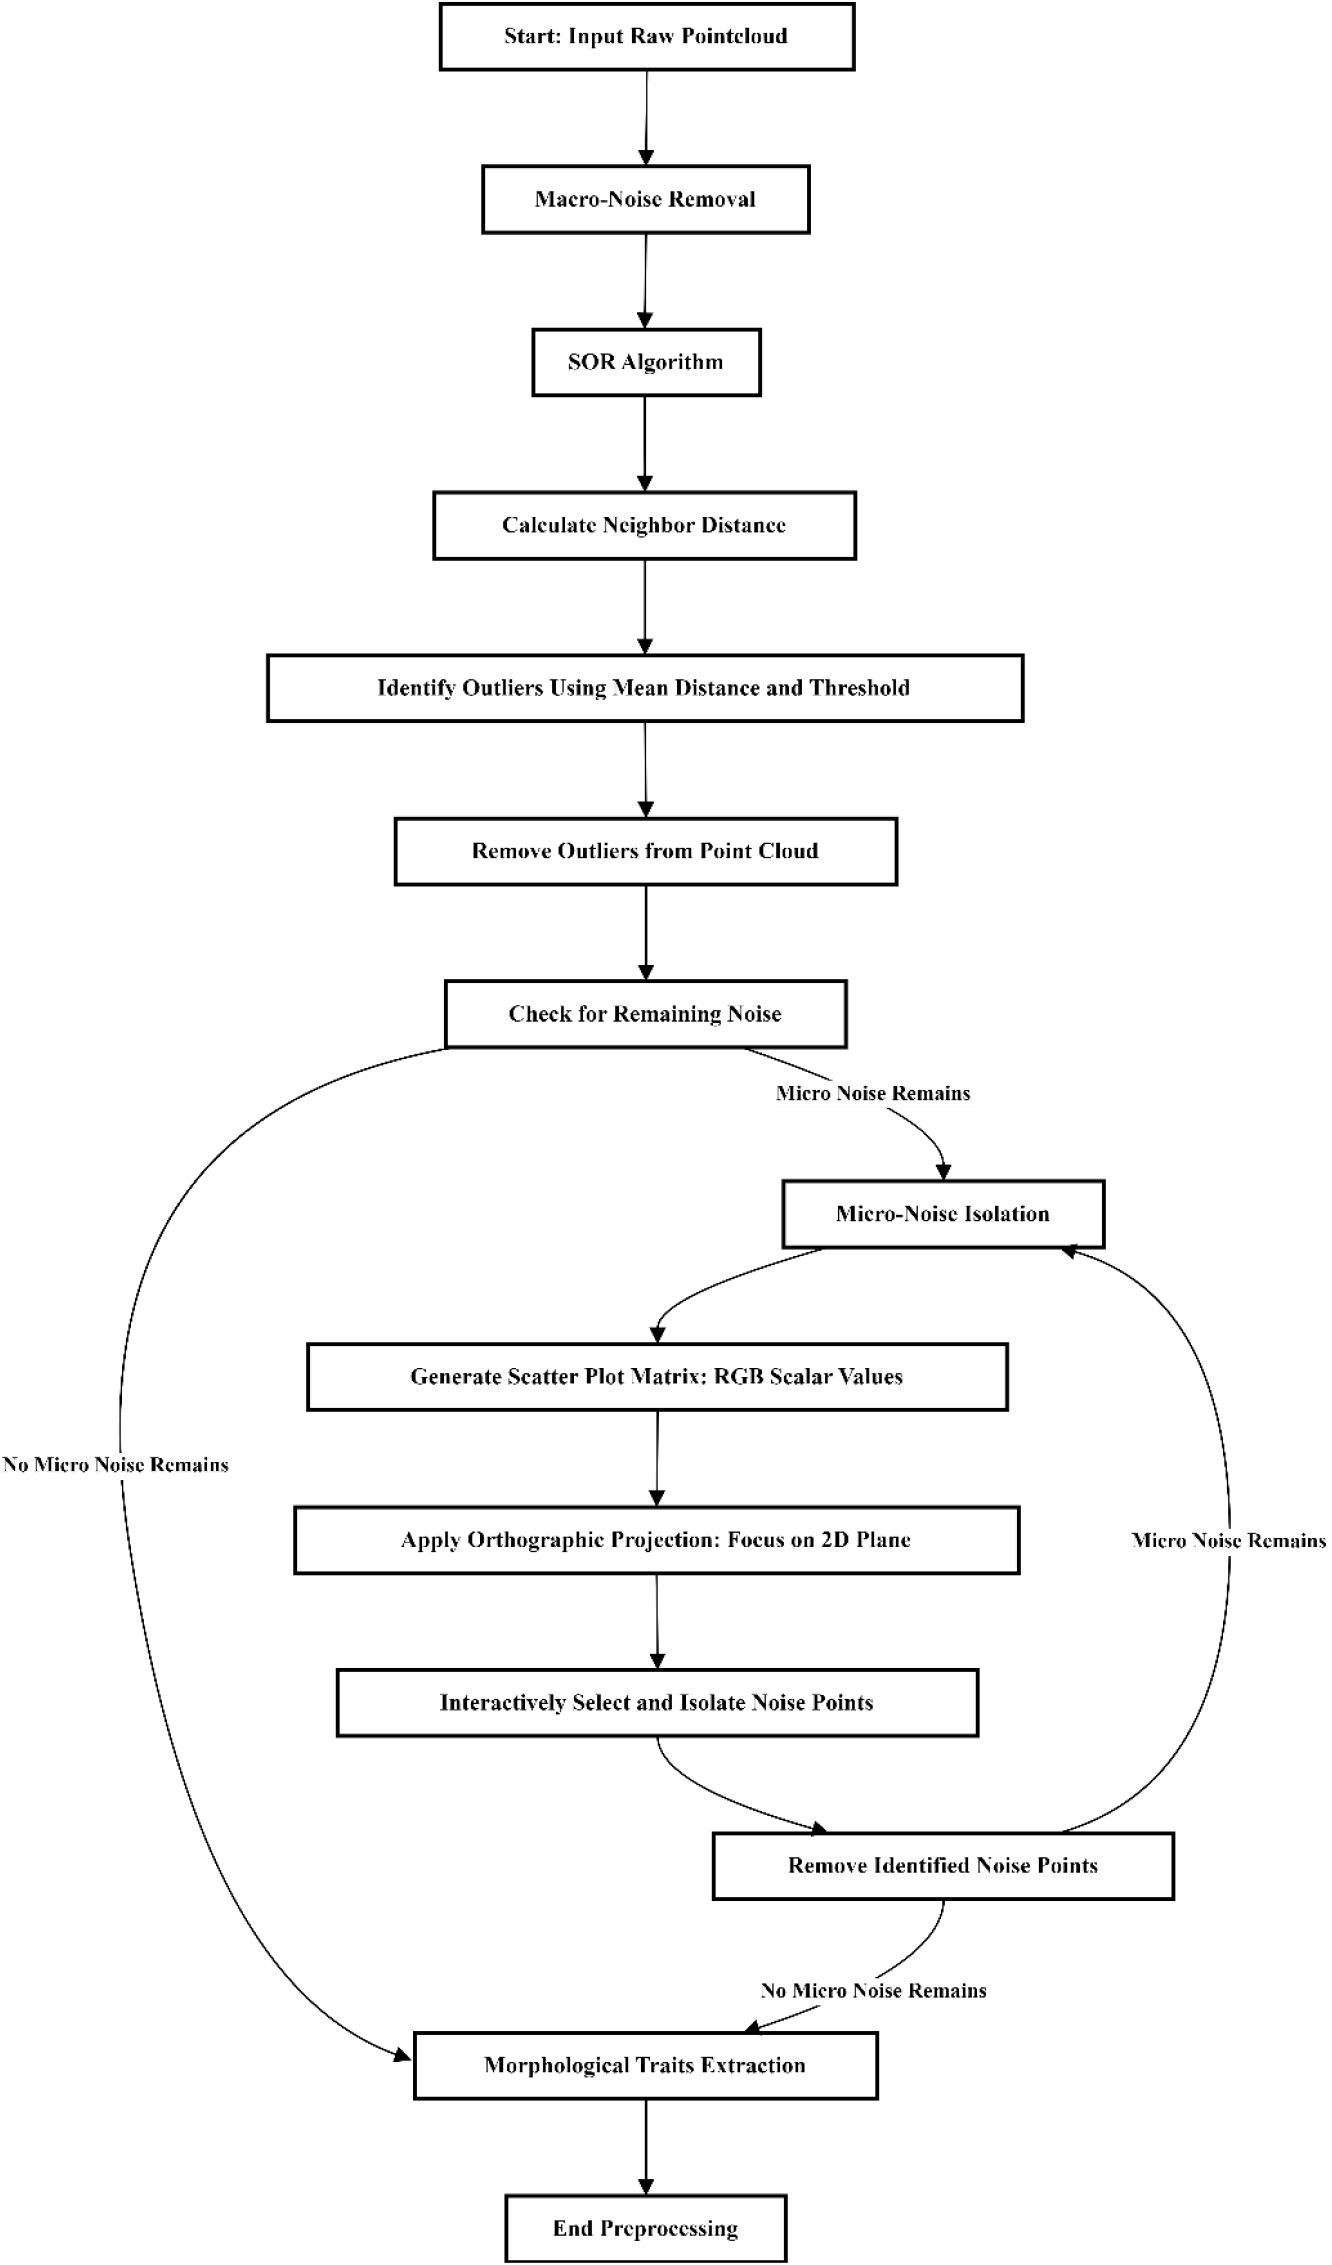
To prepare the point clouds for effective morphological trait extraction, a two-stage noise removal process was implemented to address both macro and micro noise, focusing on eliminating common artifacts such as flying points and cluster points. These artifacts can significantly distort the data if not properly addressed, particularly in field conditions where noise is prevalent. A flowchart capturing the entire preprocessing workflow is provided in Fig. 2, which visually represents the sequence of steps involved in both macro and micro noise removal.
Macro-noise removal
The first stage of preprocessing focused on macro-noise removal. The sphere outlier removal (SOR) algorithm was applied to eliminate macro-noise by filtering points deviating from local density patterns. SOR identifies outliers through statistical analysis of nearest-neighbor distances, removing points exceeding a threshold defined by global distance distribution (𝜇+𝛼𝜎). Key parameters, neighborhood size () and sensitivity factor (𝛼), were optimized to preserve structural integrity while excising artifacts. This density-based approach is particularly effective for irregular plant architectures, as demonstrated in prior phenotyping studies. A more detailed description of the SOR method is provided in the Appendix I.
Micro-noise isolation
Following the SOR process, micro-noise that persisted in the point cloud was further isolated using a scatter plot matrix approach based on the RGB scalar values. Since the micro-noise are believed to be coming from the dust aerosols suspended in air, their RGB scalar values are easily distinguished from those of the plant points. RGB-based noise isolation requires simultaneous assessment of red, green, and blue value relationships. Scatter plot matrices excel at visualizing pairwise correlations across multiple variables (RGB channels), enabling targeted identification of spectral outliers that simpler thresholding methods might miss.
The scatter plot matrix was generated using the ParaView’s Plot Matrix View (Kitware, 2024), a tool based on visualization toolkit (VTK) that enables the identification of correlations between pairs of variables within the point cloud (Schroeder et al., 1998; Squillacote et al., 2007).
In this case, orthographic projection was utilized to project the 3D point cloud data onto a 2D plane. This type of projection is described by the following relationship:
where, represents the original 3D points, are the 2D projected points, and is the orthographic projection matrix defined as :
This matrix transforms the 3D coordinates by ignoring the depth information (Z-coordinate), which is essential for focusing on the X and Y coordinates during the scatter plot matrix analysis. This method allows for the visualization of the data in a way that makes it easier to identify noise points that cannot be removed through standard methods like SOR.
By interactively selecting and isolating the noise points based on their distinct axis color intensity within the scatter plot, it is possible to eliminate them from the dataset. This additional preprocessing step was crucial for ensuring the accuracy of subsequent morphological trait measurements, particularly for traits such as stem diameter. The flowchart in Fig. 2 provides an integrated view of both macro and micro noise removal processes, illustrating the comprehensive approach used to refine the point cloud data.
Morphological traits extraction
The advancement of structural crop phenotyping to real-field conditions necessitates a systematic approach to morphological trait extraction, structured within a pipeline of discrete steps of target plant and/or plant organ identification, isolation and trait quantification. In this study, the process is facilitated by a custom-built UI that integrates trait measurement filters for automated extraction of parameters such as height and width from selected regions. The UI is also equipped with robust visualization and point navigation features powered by VTK algorithm (Schroeder et al., 1998).
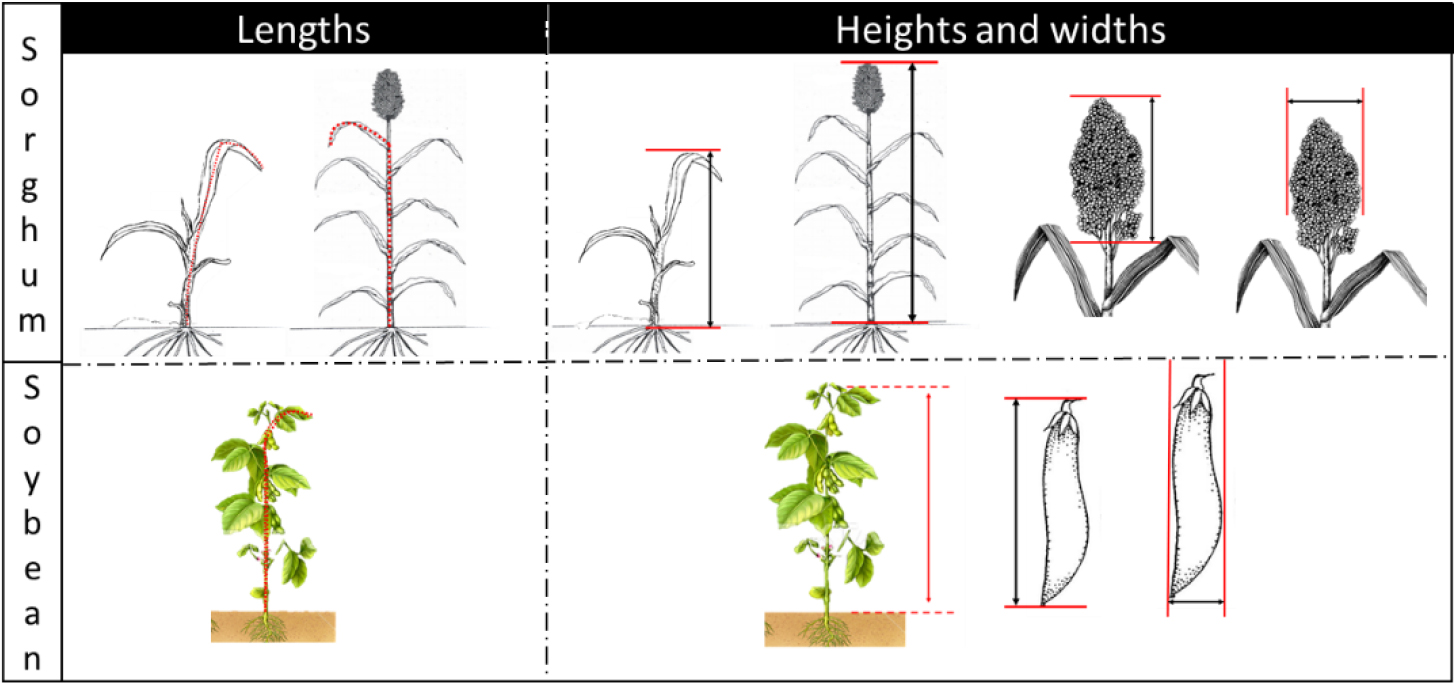
The initial step in the pipeline involves an interactive, human-assisted selection of the target region or specific points within the point cloud. Based on the morphological trait of interest, users can apply the appropriate filter to extract the relevant parameter. Since morphological traits typically pertain to directly observable or measurable features (Fig. 3) such as distances (e.g., height, width, diameter, and length) and derived traits like volume, the phenotyping filters are categorized into four main groups: (a) length measurement, (b) height and width measurement, (c) diameter measurement, and (d) surface area and volume measurement.
While this study primarily focuses on plant height and stem diameter for both soybean and sorghum, as well as sorghum panicle height and crown diameter, further research is needed to expand the scope of morphological trait extraction.
Height and width measurement
The measurement of height and width in point cloud data is a key step in extracting morphological traits, particularly when assessing plant structures such as stems. In this process, the user begins by interactively selecting the target area, such as a stem, by drawing a bounding box around the region of interest within the point cloud. Once the target area is selected, the custom-built UI automatically applies the appropriate filters to calculate the height and width using the equations provided.
In this context, the width measurement corresponds to the stem diameter, while the height measurement reflects the stem length or overall height. These calculations are based on the following equations (Patel et al., 2023):
Here, represents the Height (e.g. stem height), calculated as the difference between the maximum and minimum -coordinates, while represents the width (e.g. crown diameter), determined by the maximum difference between the and coordinates.
This automated approach ensures that once the target area is defined by the user, the extraction of height and diameter is both precise and efficient, facilitating accurate phenotyping in both controlled and real-field conditions. The integration of these measurements within the UI streamlines the process, reducing the need for manual calculations and improving the consistency of the results.
Diameter measurement
In plant phenotyping, several diameters are of significant interest to breeders and farmers for purposes such as genotype studies and crop management. Among the most commonly measured are stem diameter and crown diameter. Crown diameter is typically measured as the maximum width (Eq. (4)) of the entire plant, making it a straightforward process that is less affected by point resolution and micro-noise. However, this method is most suitable for single or well-isolated plants, often at early growth stages. In more complex real-field conditions, where mature plants are closely spaced and tend to overlap, isolating the point cloud of an individual plant from the overall scan becomes challenging.
Measuring stem diameter is often non-trivial for small-sized stem point cloud scanned in field condition. This is because small-sized stems commonly found in non-perennial crops, tends to be more affected by sensor resolution and are more prone to noise. For plant with relatively larger stem diameter, most studies consider measuring stem diameter as a fitted cylindrical model, an assumption that the stems approximate a uniform cylinder (De Swaef et al., 2015; Kuželka et al., 2020). This approach is more straight forward for large plants with fairly cylindrical stem but may fail in estimating diameter of small-sized field crops such sorghum, and soybean. Moreover, sorghum stem approximates an elliptical shape rather than cylindrical shape. For this reason, some studies adopt a straight-line segment fitted to the stem point clouds using the least squares method (Patel et al., 2023). In such an approach, the stem points are projected to the XZ-plane and a linear regression line that best fits the points is drawn. All projection distances from the stem points to the line segment are calculated and the median of these distances determined. The stem diameter is then approximated to be twice the median distance. This approach also has some drawbacks, one challenge associated with this approach is that the stem is assumed to be relatively straight upright along the z-axis and thus may not work for crops like soybean with bending and offset stems in some cases. This approach is also best suitable for a fully scanned plant (360° scan around the plant), but in real field, only 2.5D scanning (180° scan) is possible since the crops are planted in rows of multiple lines, thus, often only the first line from the sensor is visible without occlusion if the sensor is placed parallel to the rows.
In this study, a simple width measurement technique (Eq. (4)) was employed to represent the diameter of the sorghum stem. This approach takes advantage of the 2.5D scan, which provides a 180-degree view of the target stem, closely approximating the diameter of the relatively elliptical sorghum stem. For a cleaner stem without fallen or peeling leaf sheaths, a cylindrical modeling approach could also be adopted. However, it should be noted that such conditions are not always prevalent in real-field sorghum plants.
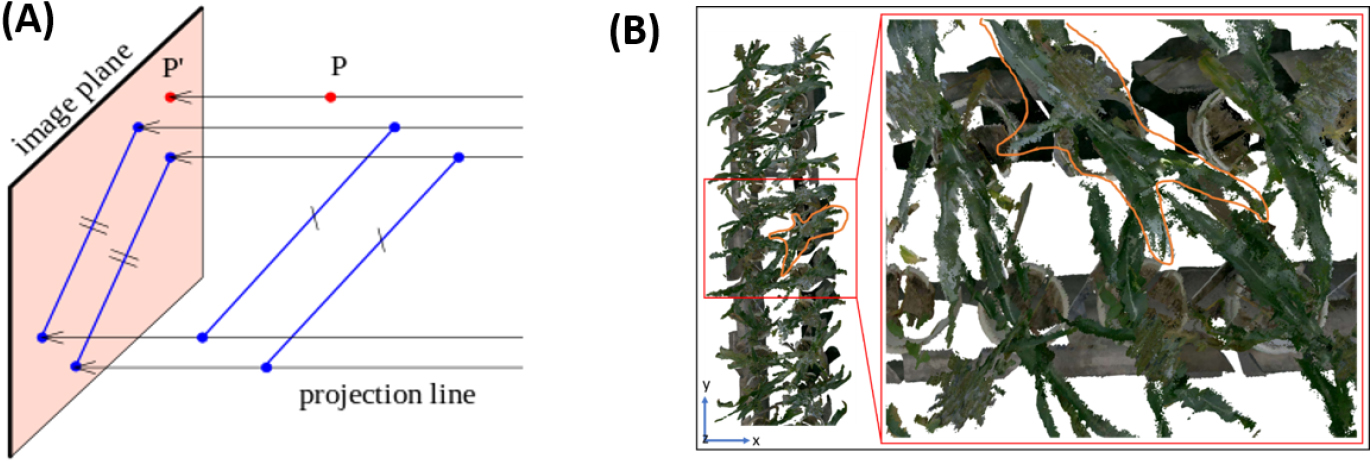
For the measurement of sorghum crown diameter, it was observed that an aerial perspective provided the best view of the full extent of each leaf. To achieve this, the point cloud was first projected onto a 2D-XY image plane, allowing the user to draw a segmentation polygon encompassing the extreme ends of the leaves (Fig. 4B). This polygon was then applied to the original point cloud to extract the points corresponding to that specific plant, and the crown diameter was estimated as the distance between the maximum and minimum values along either the X or Y axis (Eq. (4)).
Representing a 3D point cloud on a 2D image plane is a desirable but complex task in computer vision, influenced by various factors, including the intended purpose, desired visual effects, and the object’s shape (Carlbom and Paciorek, 1978). Two primary approaches to this task are parallel projection and perspective projection. In parallel projection, objects maintain consistent size regardless of their distance from the viewer, whereas, in perspective projection, closer objects appear larger, simulating human vision and photography more realistically. Given the need to reuse the drawn polygon for extracting the point cloud of a specific target plant, parallel projection was selected for this study. To achieve an aerial view, the orthographic projection type was specifically chosen to avoid oblique views.
In general terms, an orthographic projection is defined as follows: given an image plane 𝛱 described by Eq. (5) and a projection direction , where the vectors and are parallel such that and , the image : of a point : is parameterized by Eq. (6) (Fig. 4A).
Evaluation of extracted traits
To evaluate the performance of the morphological trait extraction process, correlation analysis was conducted by comparing the automatically extracted values with ground truth data obtained through manual field measurements. Two statistical metrics were employed to quantify the accuracy and reliability of the extraction process: the coefficient of determination (R2) and the root mean square error (RMSE).
These metrics were selected for their robustness and ease of interpretation in evaluating the performance of the trait extraction process. R2 provides a normalized measure of the linear relationship between the automatically extracted traits and the manually measured phenotypic traits, while RMSE offers a scale-dependent assessment of the extraction error, reflecting the precision of the automated phenotyping methods.
Results and Discussion
The primary objective of this study was to advance 3D crop phenotyping by exploring the potential of point cloud analysis under near real-field conditions. Specifically, the focus was on the accurate extraction of measurable traits such as plant height, panicle height, stem diameter, and crown diameter. These traits are critical for assessing genotype performance and facilitating precision crop management. Given the challenges inherent in field environments, such as dense plant overlap, self-occlusion, and uneven terrain, this study aimed to evaluate the accuracy and reliability of these phenotypic measurements when derived from LiDAR-generated 3D point clouds.
The results and discussion are organized to reflect the structured approach taken in the methodology. First, the outcomes of the data preprocessing steps are presented, highlighting the effectiveness of noise removal and point cloud quality enhancement. This is followed by a detailed examination of the extracted morphological traits, including height and width measurements, diameter measurements, and multivariate analysis results. Each section will discuss the findings in the context of their implications for plant phenotyping, the challenges encountered, and the potential for further refinement of the techniques used.
Data preprocessing
Noise removal effectiveness
The application of the SOR algorithm significantly enhanced the quality of the point cloud data by addressing common artifacts such as flying points and cluster points. These artifacts, which were prevalent in the raw point cloud data, posed significant challenges to the accurate extraction of plant morphological traits. As shown in Fig. 5B, flying points were particularly problematic, often aligning with the sensor’s direction vector and scattering throughout the main point cloud. The SOR algorithm effectively identified and removed these outliers by analyzing the local point density, thereby reducing the presence of these artifacts in the final dataset.
Fig. 5C illustrates the outcome of the SOR algorithm, where the blue points represent the identified outliers that significantly deviated from their neighboring points. By adjusting the number of neighbors and the standard deviation threshold, the algorithm was fine-tuned to remove only the most significant outliers, resulting in cleaner and more coherent point cloud (Fig. 5D). This improvement in data quality was critical for ensuring that subsequent morphological trait measurements were based on accurate and reliable data.
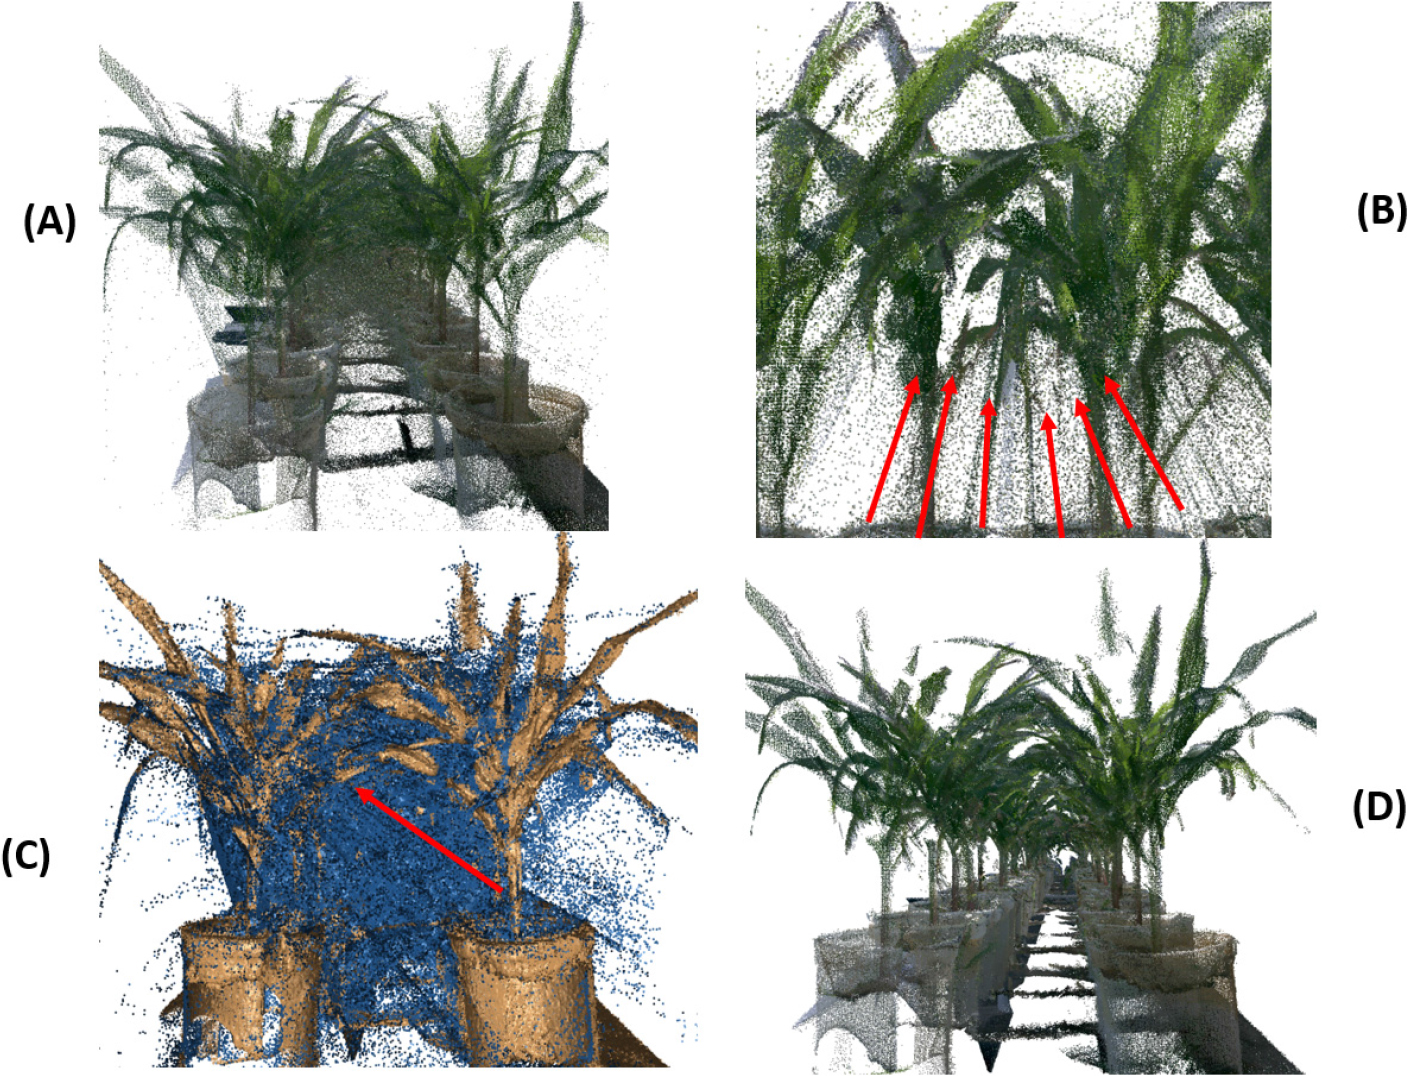
Fig. 5.
Illustration of point cloud pre-processing. (A) Raw point cloud with artifacts and unwanted regions. (B) Example of flying points (aligned along the lidar channels paths). (C) Points identified as outliers using the sphere outlier removal (SOR) algorithm, indicated by blue points. (D) Resulting cleaned point cloud after removing outliers and unwanted regions.
Micro-noise isolation and its impact on trait measurement
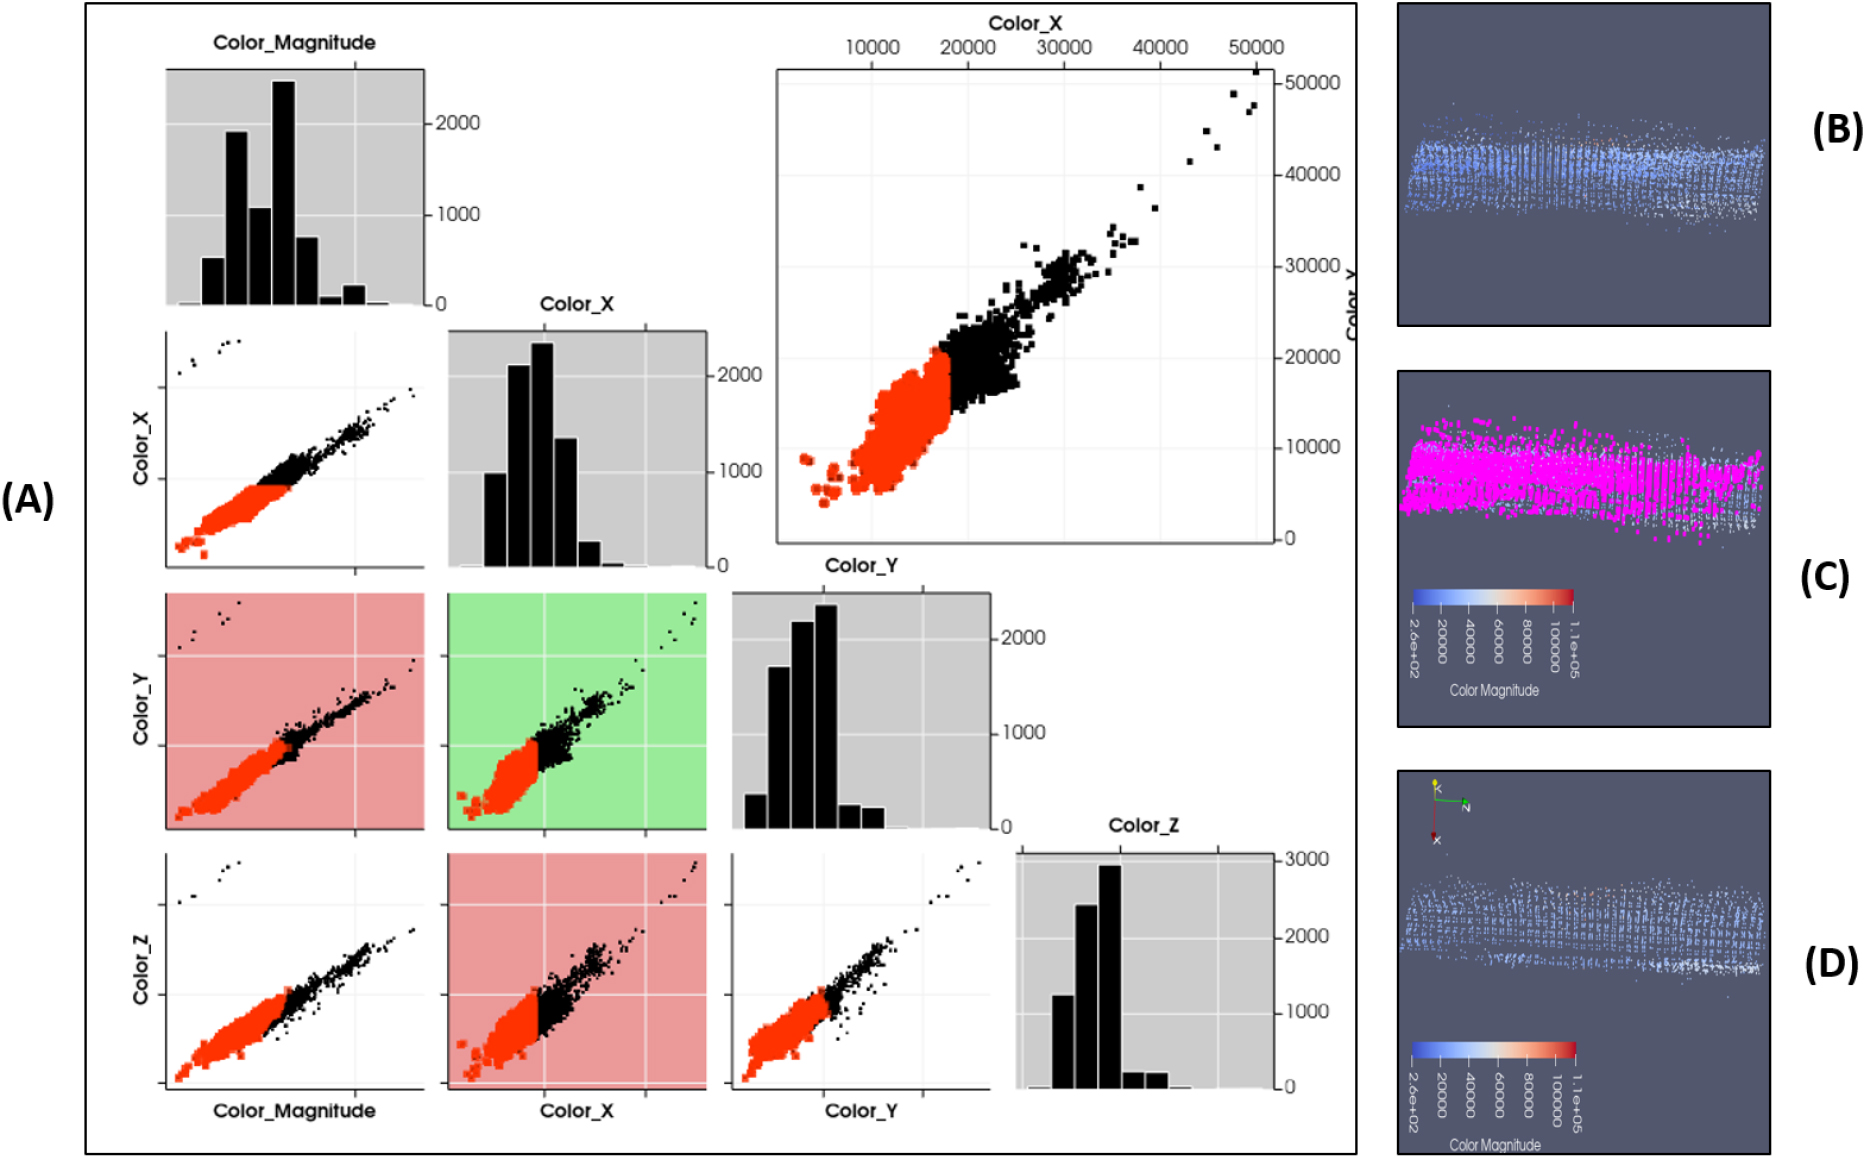
Despite the effectiveness of the SOR algorithm, some micro-noise persisted in the dataset (Fig. 6B), which could potentially lead to overestimations in specific analyses, such as stem diameter measurement. To address this, further preprocessing was conducted using a pair-wise scatter plot matrix generated through the ParaView Plot Matrix View (Kitware, 2024). This tool allowed for a detailed examination of the point cloud RGB scalar values, helping to identify correlations between variables and isolate regions of micro-noise.
As depicted in Fig. 6A, the scatter plot matrix enabled the interactive selection of noise points, which were characterized by lower intensity values compared to the actual point cloud. These points were manually deleted, as illustrated in Fig. 6C and D, ensuring that the remaining data was free from both macro and micro noise. This step was particularly important for accurate trait extraction, as it minimized the risk of measurement errors that could arise from the presence of residual noise.
The use of the ParaView Plot Matrix View (Kitware, 2024) proved crucial in refining the data for high-precision measurements. The ability to customize the view, including setting colors for active plots and controlling the visibility of various elements, enhanced the clarity and accuracy of the noise removal process. By leveraging these capabilities, the final point cloud data was not only noise-free but also well-suited for the subsequent extraction of morphological traits.
The combination of the SOR algorithm and the scatter plot matrix approach resulted in a point cloud that was significantly cleaner and more reliable for morphological trait extraction. The preprocessing steps ensured that artifacts were effectively removed, as evidenced by the improved data quality in Figs. 5D and 6D. This enhanced dataset provided a strong foundation for the accurate measurement of plant height, stem diameter, crown diameter, and other critical traits.
These preprocessing techniques not only improved the accuracy of the extracted traits but also highlighted the importance of thorough data preparation in real-field conditions, where noise and artifacts are more prevalent. The successful implementation of these methods demonstrates their potential for broader application in plant phenotyping, particularly in challenging environments where traditional methods may fall short. However, since the scatter plot matrix of RGB depends on color intensity, a potential limitation might arise if the noise has closely overlapping color values. For example, in a real field, there are always weeds around the stem and any noise arising from the weed may not be captured due to similarity between the ween and the plant.
Phenotypic traits measurements
Height, width, and diameter measurement
The extraction of morphological traits such as height, width, and diameter from LiDAR-generated point clouds plays a critical role in plant phenotyping. Particularl applications are for assessing genotype performance and informing precision crop management strategies. In this study, the key traits measured were sorghum and soybean plant heights, sorghum stem diameter, and sorghum crown diameter.
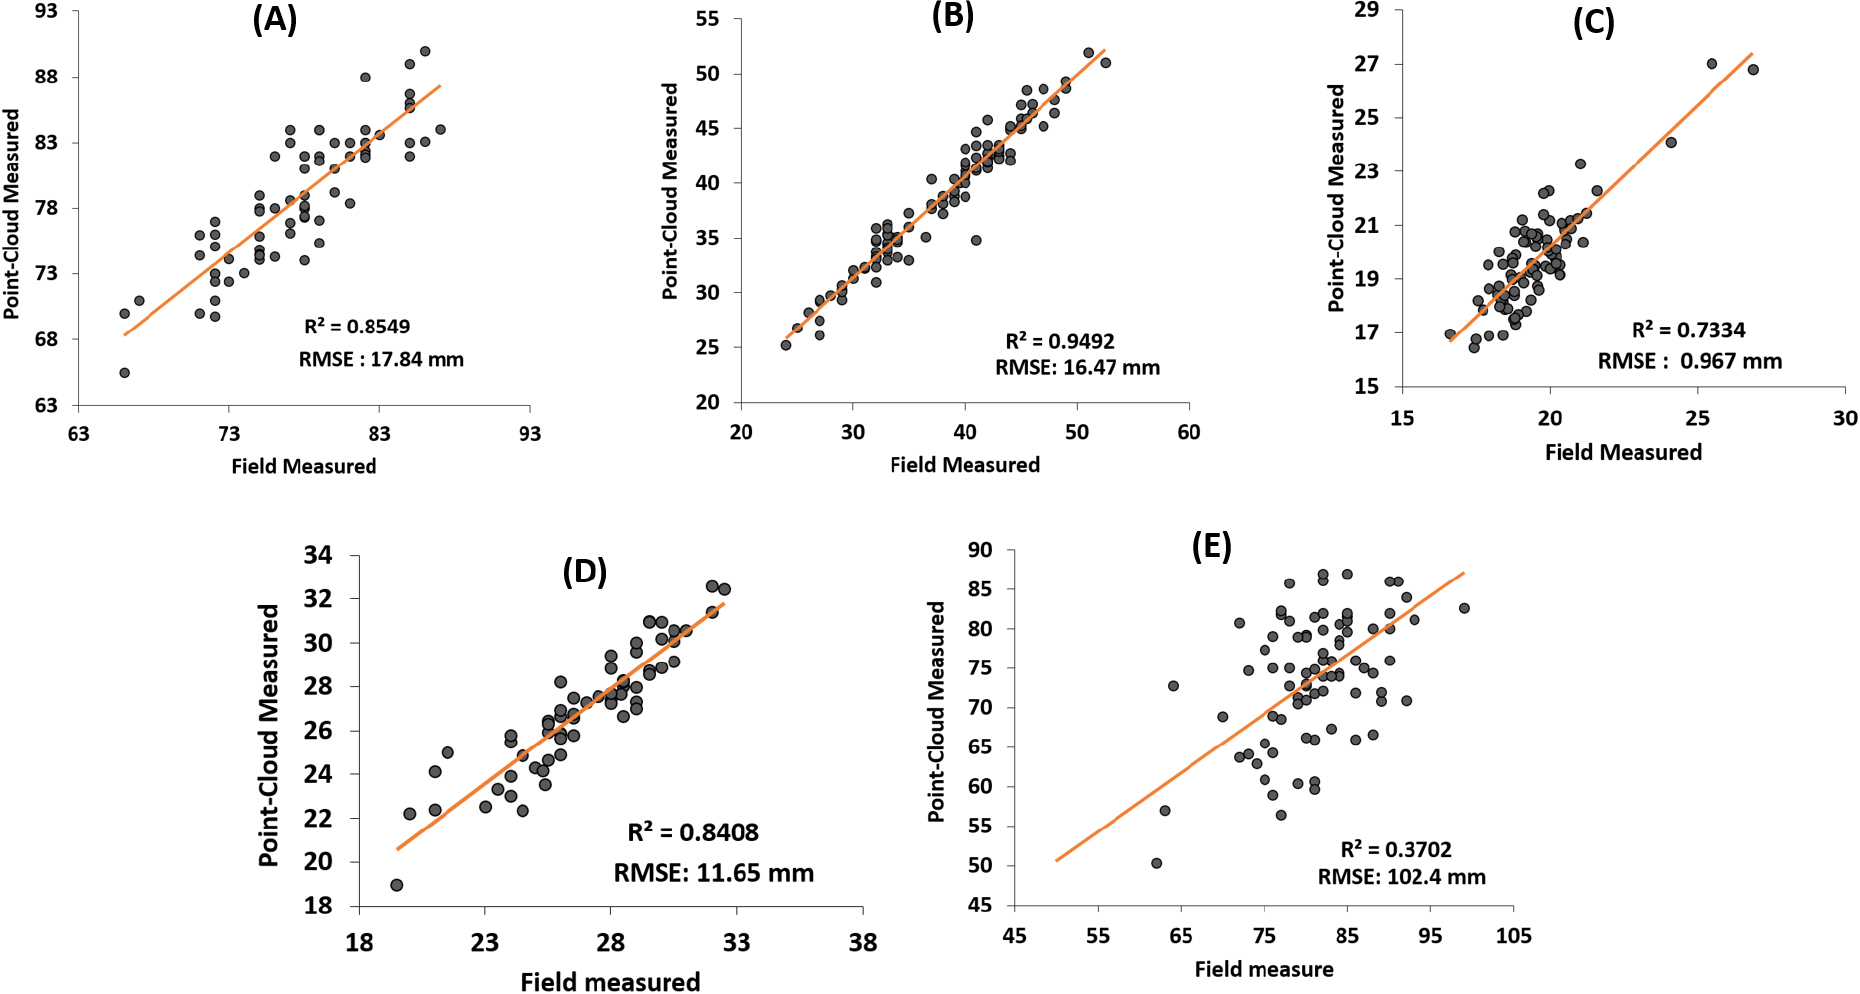
Plant height measurement: The measurement of plant height was straightforward, with LiDAR-derived heights showing strong correlation with manual measurements. Based on sample sizes of 72 for sorghum and 105 for soybean, the R2 values for plant heights were 0.8549 and 0.9492, respectively, indicating a high level of accuracy in the automated extraction process (Fig. 7A and B). The RMSE values were 17.84 mm for sorghum and 16.28 mm for soybean, reflecting low measurement errors and validating the reliability of LiDAR for height estimation in near real-field conditions.
These results are consistent with previous studies that have demonstrated the effectiveness of LiDAR in accurately measuring plant height in various crops. For instance, LiDAR has been shown to produce high correlation coefficients (R2 values) in measuring crop heights. Studies such as those by Kjaer and Ottosen (2015) on maize and wheat, where similar R2 values were reported, reinforce the utilization of LiDAR in field-based phenotyping.
Stem diameter measurement: The measurement of stem diameter, particularly for sorghum, an 86-sample size showed promising results with an R2 value of 0.7334 and an RMSE of 0.967 mm (Fig. 7C). In this study, a simple width measurement technique (Eq. (4)) was employed to represent the diameter of the sorghum stem. This approach leveraged the 2.5D scan, which provided a 180-degree view of the target stem, closely approximating the diameter of the relatively elliptical sorghum stem.
The complexities associated with measuring soybean stem diameter were further exacerbated by the small size of the stems and the sensor’s resolution limitations. The sensor’s 3D point accuracy of 6 mm and ranging accuracy of 4 mm within a 10 m radial buffer were insufficient to capture the detailed shape of the soybean stems, leading to potential inaccuracies in the measurement.
Given these challenges, the simple width measurement technique used in this study offered a practical alternative for measuring stem diameter under real-field conditions. However, the limitations of this method, particularly in the presence of irregular stem shapes and incomplete scans, highlight the need for further refinement and the potential adoption of more sophisticated approaches in future studies.
Sorghum panicle height measurement: The extraction of sorghum panicle height also demonstrated promising results. Based on a sample size of 63, the LiDAR-derived measurements closely matched the ground truth data, with an R2 value of 0.8408 and an RMSE of 11.65 mm (Fig. 7D). The ability to accurately measure panicle height is particularly important in phenotyping sorghum, as it provides insights into reproductive development and potential yield. The strong correlation between the LiDAR-extracted panicle heights and the manually measured data underscores the effectiveness of the point cloud processing techniques used in this study.
Crown diameter measurement: The measurement of crown diameter presented additional challenges, particularly under conditions of plant overlap and occlusion, which are common in real-field environments. Direct software measurement of sorghum crown diameter resulted in poor correlation with manual measurements, for a 78-sample size, the correlation with an R2 value of only 0.3702 and a high RMSE of 102.4 mm (Fig. 7E) was attained. The underestimation of crown diameter was primarily due to the occlusion of leaf extremities by neighboring plants, making it difficult to capture the full extent of the crown.
Recommendations and future work
The results of this study demonstrate the potential of LiDAR-based phenotyping techniques for extracting certain morphological traits, such as plant height and stem diameter, with high accuracy and reliability. However, the measurement of more complex traits like crown diameter under conditions of overlap and occlusion remains a significant challenge.
Unmeasured traits and future directions: Several important phenotypic traits, including leaf surface area, leaf inclination angle, plant volume, and crown diameter under heavy occlusion, were not successfully extracted in this study. These traits are crucial for comprehensive plant phenotyping but are difficult to measure accurately using current point cloud analysis techniques. Future research should focus on developing more sophisticated methods to overcome these challenges. This could include the application of deep learning models, which have shown promise in capturing complex relationships in point cloud data and even in auto-completing missing data points (Chen et al., 2023).
Optimizing field planting patterns: Another potential approach to improving phenotyping accuracy is the optimization of field planting patterns to minimize occlusion and overlap, while maintaining desired productivity levels. For example, opposite phyllotaxy plants like sorghum that have their leaves arranged in two vertical columns on opposite sides of the stem can be particularly oriented during transplanting such that the crown diameter is towards the row spacing. Such an approach could enhance the visibility of key plant features and improve the accuracy of trait extraction.
Interactive UI: While the use of interactive UI for trait extraction offers flexibility and precision, it also introduces subjectivity and reproducibility issues, as results can vary depending on the user’s expertise and decisions during the selection process. Future work should explore the integration of deep learning models to automate and standardize the segmentation process, reducing the variability in results and enhancing the consistency of phenotypic measurements.
Measurement validation protocols: Whereas the case study demonstrates functional viability, advancing 3D phenotyping requires urgent attention to measurement validation protocols. Traditional tools like calibrated rulers introduce human-dependent variability during manual plant height assessments, undermining their utility as reference standards. Future efforts must prioritize developing automated ground-truthing systems (e.g., robotic measurement arms with LiDAR-guided positioning) to eliminate observer bias and ensure millimeter-level reproducibility.
Sensor limitations and alternatives: The Leica BLK360 sensor’s failure to resolve soybean stem diameters exposes critical hardware constraints. Structured light systems or high-density laser triangulation sensors could address this by capturing submillimeter morphological details. However, these technologies demand trade-offs: their narrow field of view necessitates slow, proximity-based scans, reducing scalability. Hybrid approaches, combining rapid aerial LiDAR for coarse structures with targeted ground-based scans for fine features, may balance resolution and throughput.
Toward autonomous workflows: Though the current interface allows selective plant analysis, its manual operation limits scalability. Emerging work by Patel et al. (2023) showcases convolutional neural networks that auto-identify stems and nodes in 3D point clouds. Integrating such models could standardize segmentation, minimize operator-induced variance, and can potentially accelerate processing time.
Conclusion
This study explored the potential of human aided 3D point cloud analysis for phenotyping crop under near real-field conditions using a custom-built desktop application. Ground truth validation results were reported for traits extracted from soybean and sorghum plant. Except for the sorghum crown diameter, the other evaluated traits showed promising results with RMSE of estimation as low as < 20 mm and < 1 mm respectively for different heights and sorghum stem diameter. Due to very small sizes of the soybean stem, typically in the range of 4 mm, the resolution of our sensor (ranging accuracy of 4 mm @ 10 m and 7 mm @ 10 m) could not capture sufficient point cloud for soybean stem analysis. While LiDAR-based phenotyping holds great promise for field-based crop analysis, certain challenges remain, particularly in the measurement of complex traits under real-field conditions. Addressing these challenges will require a combination of advanced computational methods, optimized field practices, and continued refinement of measurement techniques. The insights gained from this study provide a foundation for future developments in high-throughput phenotyping and contribute to the ongoing effort to enhance crop breeding and management through innovative technological solutions.
