

Introduction
Variety of yield monitoring systems
Primary functions of the yield monitoring system
Mass flow measurement
Batch weighing
Cumulative weighing
Image-based volume measurement
Volume estimation
Other methods
Indirect yield estimation
Yield estimation by counting fruits or vegetables
Yield monitoring by mapping
Signal processing for yield monitoring
Challenges and issues
Conclusion
Introduction
Enhancing both the quantity and quality of crop yields, all while minimizing operational expenses and mitigating environmental pollution are primary objectives for precision agriculture (PA). Often specific to location, crop, and field management, this approach to farming relies on data and information to attain maximum yields and profitability, all while minimizing resource inputs and adverse environmental effects. Non-grain yield monitoring technologies play a major role in sustainable and profitable farming by optimizing cultivation processes, decreasing waste, and improving overall crop quality (Zhi et al., 2023). Yield monitoring is a critical component of precise agriculture (Pelletier and Upadhyaya, 1999; Rosa et al., 2000). Providing yield data is essential for the successful adoption of precision agriculture. This tactic has found notable approval primarily in regions such as America, Europe, and Australia, where agricultural lands and machinery are of considerable dimensions. It has also captured attention in Asian nations, even though, there, fields tend to be smaller in size. However, the applicability of precision agriculture could be notably higher in Asian nations due to three main factors, namely, heightened consciousness of environmental issues, the need to enhance the value of agricultural products, and the scarcity of labor caused by a declining and aging rural population (Srinivasan, 1999). The fundamental idea behind precision agriculture is recognizing the presence of variations in site characteristics such as crop growth and yield, soil characteristics, climate, and field shape. The goal is to resolve these disparities at the level of specific points within fields to increase economic benefits and lessen environmental effects.
An integrated precision agriculture approach involves comprehensive data collection, decision-making and management strategizing, precise field operations, and regular evaluations (Sudduth, 1998). Gathering and applying spatial information related to crops, soil, and environmental factors is a crucial phase in implementing PA. Improvements in mapping and measuring agricultural yields have been a major driving force behind the development of PA (Karunathilake et al., 2023). Yield monitoring encompasses the live detection of crop output by a harvester as it traverses the field, while yield mapping illustrates the geographical disparities in yields. The development of yield maps is a significant part of precision agriculture because they provide critical information for the assessment step of the precise farming process. To illustrate, they provide localized information about nutrient absorption, soil discrepancies, and the effects of specialized treatment approaches (Reitz and Kutzbach, 1996). Furthermore, crop yield is the cornerstone for many agricultural resource suggestions. The collection of yield data from crops and positional data through on-the-go sensor-based techniques (resulting in the creation of yield maps) was refined in the late 1980s by Searcy et al. (1989) and Bae et al. (1987). Since then, there have been notable advancements in yield monitoring systems, with some commercial operations achieving average load accuracies of about 1% (Magney et al., 2017). Prior studies on yield monitoring and mapping algorithms have been well-documented (Pathak et al., 2012; Demmel, 2013).
Over the past three decades, systems for crop yield monitoring and yield mapping have been devised for a range of crops including grains, forage, root crops, and others. Blackmore and Marshall (1996) identified six key factors that make producing a precise and reliable yield map difficult. These are the delay in grain passing through threshing mechanisms, uncertainties regarding crop width as it goes into the header section when harvesting, errors from GPS deviations, irregular grain movement within the combine transfer mechanism, loss of grain within the combine, and sensor precision and calibration. The same period witnessed significant advancements in the field of crop-specific yield monitoring systems and the development of diverse hardware solutions. In this article, we will explore the research trends of the last 30 years, delve into the essential elements and principles that underlie yield monitoring systems, and evaluate how hardware components have evolved, focusing on crop types and variables employed for measurement. Factors that contribute to the advancement of agricultural research include summarizing existing knowledge and comparing and analyzing technology advancements. The practical implications of data accuracy and precision include accurately evaluating the economic considerations of their integration with agriculture and identifying gaps and limitations. In summary, the study of non-grain crops can provide a holistic view of the current state of research in this field, guide future research directions, and offer practical insights for those involved in agricultural production and technology development.
Variety of yield monitoring systems
Yield monitoring refers to the process of measuring and quantifying the crop yield or production of a farming operation. It involves collecting data on the amount of agricultural produce, such as grains, fruits, vegetables, or any other crop, that is harvested from a specific area of land. Yield monitoring typically involves the use of specialized equipment and techniques like yield monitoring sensors and GPS technology (Tumbo et al., 2002). These devices are installed on harvesting machinery, such as combines or harvesters, to gather data about crop yield and performance during the harvesting process. Yield monitoring systems gather much different information, such as the weight or volume of the harvested crop, the location of the harvest, and other factors like moisture content or quality traits. This data is collected and evaluated to gain insight into the spatial and temporal differences in agricultural output across a field or farm (Lamb and Brown, 2001). Farmers and agricultural experts can assess the effects of management practices or environmental factors, identify variations in yield across different parts of the field, and make well-informed decisions about fertilizer application, irrigation, crop choice, and other farming practices by tracking and analyzing yield data. In modern agricultural operations, yield monitoring increases crop productivity, resource efficiency, and eventually profitability (Thomasson et al., 2006).
Primary functions of the yield monitoring system
Yield monitoring systems have revolutionized modern agriculture by providing real-time insights into crop productivity and efficiency. These systems enable the measurement and documentation of crop yields as they occur, facilitating accurate data collection for informed decision-making. The various sensors and technologies used in yield monitoring systems for non-grain crops include:
• Optical sensors to assess plant health, growth, and stress levels, providing valuable insights into yield potential (Xue and Su, 2017)
• GPS for dereferencing yield data, creating yield maps, and supporting precision agriculture practices (Xue and Su, 2017)
• Accelerometers to understand the impact of machinery on crop yield and aid in optimizing equipment performance (Kaur et al., 2023)
• Load cells to provide real-time data on crop yield and calibrate other sensor measurements (Lee et al., 2018)
• Infrared sensors to identify temperature anomalies in the field, indicating areas of stress or potential yield variations (Kumar et al., 2022)
• Ultrasonic sensors for understanding plant growth patterns and aiding in estimating biomass and yield (Senthil et al., 2023)
• Soil sensors to analyze the impact of soil conditions on crop performance and optimize irrigation and fertilization practices (Bhatt et al., 2021)
• Cameras for image data to be processed using computer vision techniques to extract valuable information about crop status and yield potential (Wang and Su, 2022)
• Light detection and ranging (LiDAR) for precise topographic mapping, vegetation structure analysis, and crop height estimation, which provides valuable information for yield assessment (Rivera et al., 2023).
These sensors are connected to the data acquisition system via wireless communication protocols, e.g., Wi-Fi, Bluetooth, and cellular networks (de Camargo et al., 2023) to support ongoing performance evaluation. By continuously monitoring and assessing crop yields, farmers can fine-tune their strategies to optimize crop output and efficiently allocate resources. The data obtained through yield monitoring also serves as a foundation for yield analysis (Menegatti et al., 2004). Patterns, trends, and correlations within the data can be identified, guiding decisions on fertilizer use, water management, pesticide application, and other farming practices. This information empowers farmers to make informed choices, promoting sustainable and effective approaches to agriculture. In essence, yield monitoring systems have become indispensable tools, driving precision and enhancing decision-making for modern farming.
Mass flow measurement
Measurement of the harvested crop for mechanically harvested specialty crops is usually performed at the last point of the fruit conveyor belt, shortly before the product is put into the transport truck. This process is illustrated in Fig. 1a and b. A notable instance of such a measurement system is continuous-weigh yield tracking (Pelletier and Upadhyaya, 1999). This system was designed to weigh tomatoes as they move along a conveyor belt during the delivery of produce from a tomato harvester. The mass flow sensor employed in this monitoring system used two separate roller sets, each consisting of a central weighing roller and two supporting rollers placed next to the weighing roller. The conveyor belt was positioned across both roller sets after being fastened to the chassis, and the sensors were positioned at regular intervals along the conveyor belt. Angle sensors were used to identify and rectify the mass flow measurements that may have fluctuated with inclination. A comprehensive mathematical analysis was conducted on the yield monitor, revealing that inaccuracies in measurement can occur due to misalignment of the support rollers (Rosa et al., 2000). The study demonstrated that this issue can be mitigated by considering the load cell response with no tomatoes on the conveyor belt (null load). The analysis also yielded valuable recommendations for the configuration and spacing of the rollers to optimize performance.
A system that was created for monitoring sugarcane yield supported a weigh plate with load cells (Cerri and Magalhães, 2005). Additional sensors that detected the conveyor's inclination and speed were mounted in the elevator of the sugarcane harvester. The yield measurements had a maximum error in the field testing of 6.4% under various conditions, including sugarcane varietals, maturities, and flow rates (Benjamin et al., 2001). Their research showed that the type of sugarcane significantly changed the system's results but neither the flow rate nor the sugarcane maturity level did. A different yield monitoring system for sugarcane was created by Molin and Menegatti (2004). Their field assessments, however, showed an average inaccuracy of up to 8%. In a different context, Pantazi et al. (2016) created a yield monitor for silage with load cells and a moisture sensor. It was mounted on the silage trailer rather than the harvester to minimize vibration noise. Field tests showed that this technique offered precise measurements within 2% of the total harvested crop. A mass-flow citrus yield monitoring system constructed under well-controlled lab circumstances by Bora et al. (2006) was most accurate when the mass flow rates utilized for calibration were similar to those experienced during actual measurements.
A popular technique for monitoring grain yield is the impact-type mass-calculating sensor, which is shown in Fig. 1c. During harvesting, this sensor's harvested crop is in contact with an impact plate that is held in place by load cells. The mass of the crop can be determined by examining both the load cell data and the impact velocity. However, for fruit and vegetables, a detailed understanding of the coefficient of restitution for the crop is essential for accurate readings utilizing impact-type yield monitors. The coefficient of restitution measures how fast an object moves before and after impact. An object with a coefficient of restitution of 1 is elastic, which means it bounces back at the same speed after impact. In contrast, an object that has a coefficient of restitution of 0 sticks to the item with which it collides. A crop's coefficient of restitution fluctuates greatly depending on maturity and moisture content (Pelletier and Upadhyaya, 1999). Upadhyaya et al. (2006) studied the principles of impact mechanics to provide additional insight and understanding of these yield monitors. There are many other sensors that can be used for mass flow measurement. Table 1 summarizes information about sensors used for mass flow measurement and their installation locations.
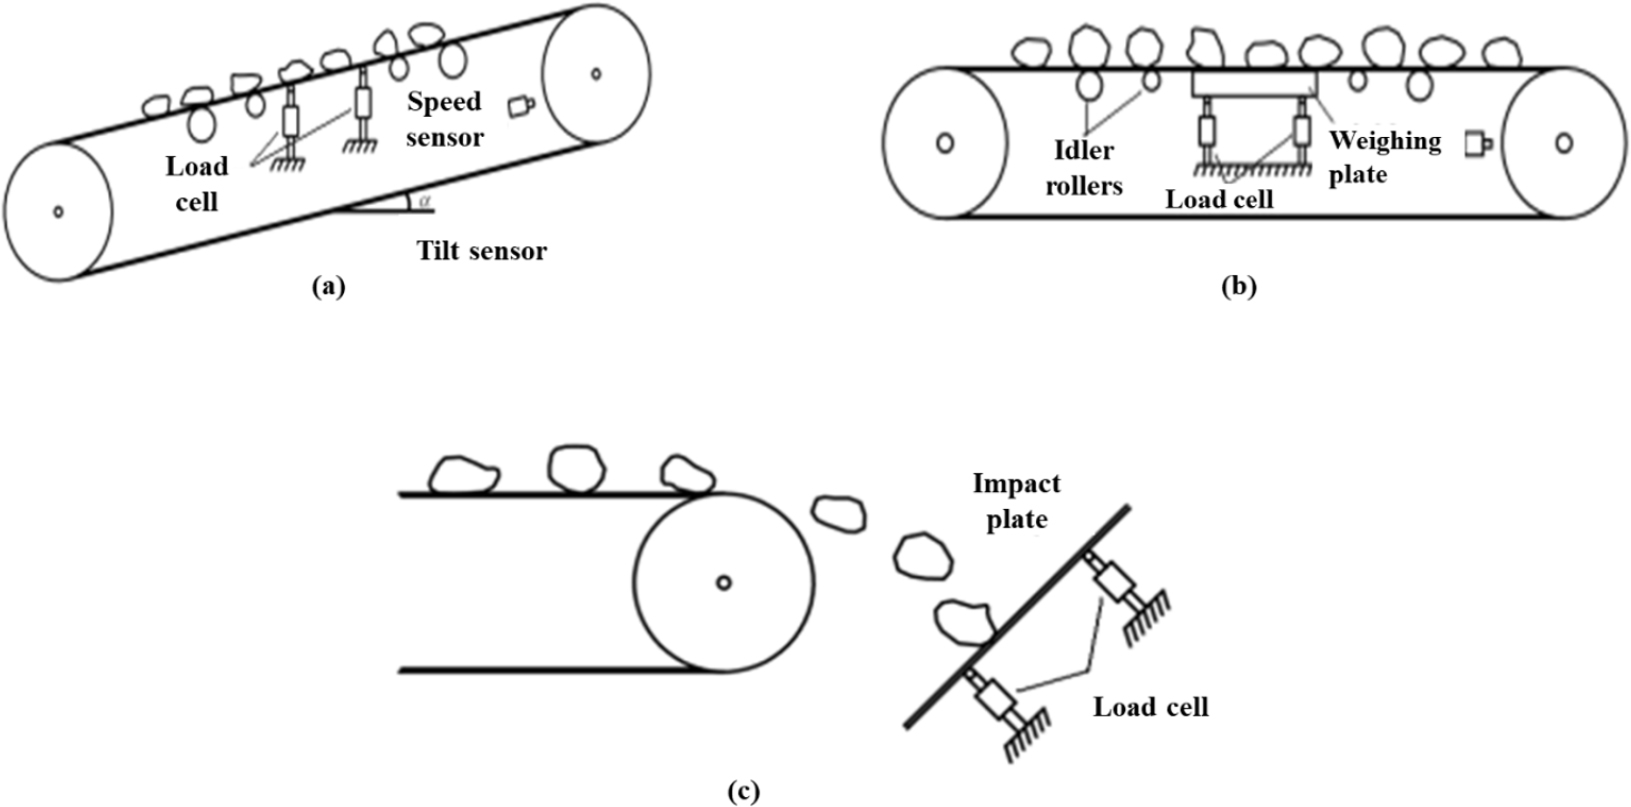
Fig. 1.
Schematics of common yield monitoring systems for specialty non-grain crops (Ehsani and Karimi, 2010).
Table 1.
Sensors used for mass flow measurement and their installation locations.
Batch weighing
The continuous flow of produce is divided into batches in this design, and each batch is then given to the hauling truck after being weighed. This idea is illustrated schematically in Fig. 2. Both Cerri et al. (2004) and Abidine et al. (2003) documented the creation and improvement of a yield monitor of the weigh-bucket variety specifically created for non-grain crops like tomatoes, potatoes, and radishes. During the harvesting process, a weigh bucket was placed at the tip of the harvester boom for yield monitoring. The weight of the harvested produce inside the bucket was continuously measured using four load cells. Field testing confirmed a strong correlation of 99% between the yield monitor's output measurements and the actual weight of the harvested yield.
Fig. 2.
Schematic diagram of a continuous flow of crops converted into batches (Ehsani and Karimi, 2010).
Cumulative weighing
Cumulative weighing systems are frequently used in harvesting equipment or transportation vehicles to weigh crops that have been collected in containers. These techniques determine the crop's overall weight over a period and are often very precise. However, it is important to compute the rate at which the cumulative weight grows to establish the instantaneous yield, such as for yield mapping applications. Vellidis et al. (2001) developed a cumulative weighing method specifically to track peanut yields. Thomas et al. (1999) provided a detailed account of how this type of yield monitor was developed. The system measures the collection basket's weight in the peanut harvester using load cells. Numerous possible sources of inaccuracy were found and resolved. Implementing filtering techniques effectively mitigated the effects of harvester vibrations and irregular fields. It was also projected how long the harvest would take. Three harvesting seasons were used to evaluate the approach, and the results revealed that the measurements were accurate to within 1% of the actual weight.
Accurately measuring the weight of foreign debris collected by the harvester was one of the biggest challenges. Through field tests, the researchers arrived at a straightforward linear equation that they could use to calculate the net pecan yield by taking into account both the pecans' total weight and any foreign material (Rains et al., 2002). A good correlation of 84% was found between the yield data obtained from this technique and the actual yield for individual pecan trees. An alternative method used by Behme et al. (1997) for determining bale weight involved combining the output from all three load cells, using a drawbar load cell, two weigh axle load cells, and a third load cell. The system's performance was tested in the field, and the results revealed an overall error of between 2.5 and 5.2%. Wild and Auernhammer (1999) developed a similar round baler yield monitoring system using a collection of strain gauges. These strain gauges were installed on the drawbar and the baler axle in a manner reminiscent of that utilized by Behme et al. (1997). The measurement errors of this system were shown by field tests to be less than 1%. In conclusion, these studies demonstrate diverse yield monitoring techniques for various equipment and crops. Their evaluation results show promising levels of accuracy for yield measurement as they handle specific issues like accurately measuring bale weight and estimating foreign material weight in pecan crops.
Image-based volume measurement
The main goal of image-based yield monitoring systems is to calculate the volumetric flow rate of crops and then translate that value into a measurement of mass. Computer vision or optical methods, like laser scanners, are frequently used to do this. An optical sensor for sizing tubers was evaluated by Persson et al. (2004) showing that it could precisely ascertain the quantity and size of perfectly spherical objects in laboratory tests. Moreover, the measurements remained accurate even when there were changes in the camera’s tilt or variations in the position of the objects within its field of view. In field tests using a commercially available potato harvester, the weight of the tuber and the number of pixels contained in the image of the tuber were found to be significantly correlated with an R2 value of 0.91. The author explained measurement inaccuracies by differences in moisture content and camera orientation. The findings of a field experiment comparing the data from an optical sensor and a load cell showed that there was an average difference of 3.2% between optical sensor measurements and load cell values. Gogineni et al. (2002) created a computer vision-based sweet potato yield monitor that converted the RGB color model into a distinctive color representation that made it possible to recognize individual pixels based on their chrominance and brightness properties. The goal was to distinguish between earth clods and sweet potatoes in photographs taken with a digital color camera. The sweet potatoes were then located and identified inside this new color domain using a mix of techniques including color thresholding, edge detection, and segmentation. For each sweet potato that was found, several metrics including area, polar moment of inertia, rectangular width and height, and major and minor axes were calculated.
The development of multiple linear regression and neural network models for calculating the weight of sweet potatoes used various combinations of these features. The algorithm produced the best results when all the features were used. Both approaches produced estimates that were quite accurate, although the multiple linear regression approach fared better than the neural network approach, with a remarkable accuracy of at least 95.02%. The described system was deployed on commercial potato harvesters and evaluated under real-world conditions in the field. Between the number of sweet potatoes detected by the image analysis algorithm and the manual count, the neural network method achieved a coefficient of determination of at least 91.02. The discriminant analysis method, on the other hand, produced a coefficient of determination of at least 80.02 (R² ≥ 0.80). The scientists attributed the reduced accuracy to difficult conditions such as muddy ground and inadequate lighting near the borders of the camera field of view.
Bora et al. (2006) used an analogous method to design a system for calculating citrus fruit yield. The method was highly accurate in detecting fruits that seemed entire in the photos, according to laboratory testing. However, recognition mistake rates were much higher when the fruit images were incomplete. Overall, the system detected fruit with an accuracy of 85%. In their investigation, Konstantinovic et al. (2008) used an ultra-wideband ground-based radar apparatus to find sugar beets in the soil. The system identified the presence of sugar beets with a high accuracy rate of more than 90%. In addition, they discovered an 83% association between the reflected energy acquired by the radar system and the mass of individual sugar beets. Their laboratory experiments showed that many factors, including the size and depth of the objects, the soil's moisture content, and the soil's surface roughness, all had an impact on how easily buried things could be found. Greater soil moisture content and rougher soil surfaces made it harder to identify smaller and deeper objects, which were also more difficult to find.
Volume estimation
Yield estimation devices are intended to calculate crop volumetric flow rates. Zaman et al. (2006) conducted research on blueberry crops during harvest. They used a color camera to take top-view pictures of the crops and created an algorithm for the computer to count the blue pixels in each picture. Manual harvesting was used to determine the actual yield, and a linear regression analysis was used to establish a relationship between the percentage of blue pixels in the photos and the blueberry yield. The correlation between the two variables was found to be extremely significant, with a coefficient of determination of 98.02. The regression model developed from measurements in one field was then used to forecast blueberry yield in another. With a coefficient of determination of 99.02, the model predictions closely matched the actual yield. Furthermore, this method proved resistant to variations in lighting conditions.
The primary goal of PA in cropping systems is to provide information that supports better decision-making in terms of management across both space and time (Whelan and Taylor, 2013). Machine learning (ML) methods offer a considerable advantage in addressing complicated, non-linear problems by autonomously evaluating big datasets from numerous connected sources. This feature is made possible by ML techniques like Gaussian processes (Rasmussen et al., 2008). The Dirichlet process (DP) and Indian buffet process (IBP) are probabilistic and allow for the consideration of sensor noise when performing a probabilistic fusion of data from various sensors (Dalponte et al., 2012). These processes also provide confidence intervals for the predictions. In real-world circumstances, ML enables better decision-making and informed actions with little to no human involvement. It offers a solid and flexible architecture that not only emphasizes data-driven decision-making but also enables the system to incorporate expert knowledge. These features contribute to the widespread use of ML techniques in a variety of fields, proving their broad applicability to PA. Machine learning plays a crucial role in agricultural yield volume estimation because it uses data-driven methodologies to give accurate and efficient estimations of crop yields. The primary benefits are data-driven precision, real-time monitoring, crop health assessment, efficient resource allocation, crop variability customization, environmental sustainability, integration with the Internet of Things (IoT), automation, and market predictions. Yield volume estimation provides data-driven, precise, and real-time insights that enable farmers to optimize their practices, reduce waste, adapt to changing environmental conditions, and ultimately improve agricultural sustainability and productivity. Machine learning techniques for crop yield estimation are shown in Table 2.
Table 2.
Machine learning techniques for crop yield estimation with a focus on technical aspects.
| Methodology | Discussion |
| Boosted regression trees (BRT) |
In the case of limited training samples, these machine learning (ML) techniques can handle a large number of predictors (in contrast to MLR) (Stas et al., 2016) BRT is a machine learning technique that is affected by noise, tends to overfit, and is slower compared to bagging. On the other hand, boosting has demonstrated higher accuracy compared to bagging (Heremans et al., 2015) |
|
Random forest regression (RFR) Random forests residuals kriging (RFRK) |
RF enhance the performance of bagging without the drawbacks associated with boosting. It offers comparable accuracy to boosting without limitations RFR method delivers satisfactory results even when multiple input parameters are used, provided they are highly correlated and representative (Liang et al., 2015) RFRK is an RF extension that is quite similar to RK. It is beneficial to incorporate spatial autocorrelation into the RF (Li et al., 2016) |
| Artificial neural network (ANN) |
Reduction in input parameters in a full-spectrum approach can potentially result in a decrease in inversion accuracy due to the use of artificial neural networks |
|
Statistical regression model back propagation neural network (BPNN) |
BPNN is an ANN in which the error is calculated at the output layer and propagated back through the layers. During optimization, each layer's weights are adjusted based on minimizing the predefined loss function (Wu et al., 2015) |
| Multiple linear regression (MLR) |
ANN and MLR can be utilized for agricultural modeling and prediction. MLR is an easy-to-understand approach that is very simple to implement. The difficulties of practical application make ANN a considerably more advanced technique (Kaul et al., 2005) |
|
Particle swarm optimization (PSO) algorithm Random forests (RF) |
FCM offers better protection against overfitting and noisy data than other regression techniques. The RF method ignores spatial autocorrelation information |
| Fuzzy cognitive mapping (FCM) |
PSO algorithm optimizes the difference between two populations. It helps to improve the predictions (Jin et al., 2016) |
Other methods
Indirect yield estimation
Indirect yield estimation involves many interrelated factors, including measuring the extent of the tree canopy. In a study by Zaman et al. (2006), it was established that measurements of the size of the citrus tree canopies could serve as a basis for yield estimation. They utilized a canopy volume sensor to gauge the volume of the tree canopy and measured the yield by monitoring the location and weight of fruit containers as they were gathered by a harvesting vehicle. Data analysis revealed a strong association between tree canopy size and yield, with a coefficient of determination reaching 80%. In a similar context, Ye et al. (2008) used aerial hyperspectral images to assess the productivity of individual citrus plants. Through the utilization of the Two-Band Vegetation Index (TBVI) and multiple linear regression analysis, the researchers identified a correlation between the spectral properties of tree canopy pixels in the hyperspectral imagery and the tree yields. Notably, their study demonstrated a significant relationship between yield and the hyperspectral images captured during the peak of rapid vegetation growth. It's worth noting that citrus trees exhibit alternate bearing patterns, making it clear that relying solely on the area of the tree canopy for production estimation would be inadequate, as pointed out by the scientists. They proposed an alternative approach, combining canopy size and TBVI as variables for yield prediction. These two factors combined accounted for 76% of the yield variability.
Yield estimation by counting fruits or vegetables
The primary aim of yield estimation systems is to work out the number of fruits, tubers, or other items located either on trees or within harvesting equipment. The overall yield can be determined by correctly counting the objects and estimating the average mass of each individual. Annamalai et al. (2004) created a machine vision system to count citrus fruits on a tree. They captured photographs of the tree canopy using a color camera mounted on a truck, and the number of fruits in each image was assessed using image analysis tools. The developed system performed reasonably well in detecting individual fruits but factors such as uneven lighting, fruit occlusion, and fruit clusters caused errors. Unfortunately, the yield prediction model developed using this technique did not perform well, with a coefficient of determination of only 53%. The study's authors advised using advanced imaging techniques, such as automatic brightness management and several cameras, to improve fruit detection accuracy. Photo interruption sensors were used in another study by Ehsani et al. (2009) to count citrus fruits individually. The fruit flow was divided into five channels, and sensors counted the fruits as they exited each channel. In controlled laboratory settings, the system exhibited an impressive level of precision, effectively tallying individual fruits with a success rate of 99.8%. However, in laboratory trials, a different theoretical approach based on the assumption that fruit arrivals at the sensor adhered to a Poisson distribution was found to be inapplicable. Consequently, this alternative method failed to accurately enumerate the fruits.
Yield monitoring by mapping
The map depicts yield variance, with a notable high-production area in the orchard's center. The yield differential between high and low production zones is nearly 50%, showing a significant variability that was not noticed by the grower who harvested the entire block uniformly. Citrus orchard yield variability can be due to a variety of factors, including differences in tree size, soil type, elevation, pest infestation, and disease infection. Molin and Menegatti (2004), Zaman et al. (2006), and Price et al. (2007) conducted studies that provide insights into the range of yield variability among different crops. They showed that citrus grove yields range from 21 to 45 Mg/ha and 9 to 54 Mg/ha, potato yields range from 40 to 100 Mg/ha, sugarcane yields range from 36 to 214 Mg/ha, and peanut yields range from less than 1 Mg/ha to 6 Mg/ha. Furthermore, for a population of 6,000 pistachio trees, field measurements of individual trees revealed variations in yield from 6 to 78 kg, with an average yield of 38.8 kg and a standard deviation of 12.1 kg. Finally, practical solutions are needed to close yield gaps in both small- and large-scale cropping strategies worldwide. These could include:
• Descriptions and strategies to measure and model yield at various levels (actual, attainable, potential) and further scales in length (field, region, province, national, and international) and time (short, long)
• Identification of the causes of yield-level disparities
• Managing options to decrease the gaps
• Approaches that favor the adoption of gap-closing new technologies.
Smart farming technologies, including ML and the IoT, can help to close these gaps by providing real-time data on crop growth and environmental conditions. This information can be used to optimize irrigation, fertilization, and pest management practices, leading to higher yields and more efficient use of resources. Muller and Vyn (2018) developed the concept of sustainable intensification that aims to increase yields while decreasing environmental impacts. Their research highlights the possibility of significantly increasing crop production by 45% to 70% through better management of fertilizer, irrigation, and climate, by closing the gaps in yield through improved agricultural practices.
Signal processing for yield monitoring
There are three primary challenges associated with collecting data when utilizing mass/volume flow sensors for specialized crops. Firstly, there's the issue of background noise that can interfere with the sensor signal. Secondly, the operation of harvesting equipment may introduce delays in the measurements. Lastly, the collected material can become disordered, leading to inaccurate measurements. Yield monitors that rely on load cells or similar methods can be sensitive to vibrations in the system. To address this, it's crucial to filter the output of these monitors before sampling to minimize vibration noise and prevent aliasing. The choice of frequencies to filter should be based on an analysis of the sensor output's frequency range, which contains vital information, and the frequency spectra of machine vibrations. For instance, Magalhães and Cerri (2007) recorded vibration frequencies on a sugarcane harvester ranging from 30 to 200 Hz, with usable yield information concentrated within 4 Hz. They utilized an analog Butterworth low-pass filter with a cut-off frequency of 9 Hz to filter the load cell output. Abidine et al. (2003) noted significant high-frequency vibrations, with peaks at 18, 36, and 45 Hz, in the load cell signal of a weigh-bucket tomato yield monitor. Durrence et al. (1999) detected a noticeable vibrating noise in a peanut yield monitor at 4.7 Hz induced by the combine's straw walker. Pelletier and Upadhyaya (1999) employed a lowpass filter with a corner frequency of 30 Hz and a stop band of 100 Hz to filter the load cell output of a tomato yield monitor. To eliminate the direct current (DC gravitational) component from a load-cell-type yield monitor, Upadhyaya et al. (2006) applied a notch filter.
Another approach for mitigating noise is the moving average method. Cundiff and Sharobeem (2003) employed a 10-point moving average to smooth the yield readings of a volumetric forage yield monitor and Lee et al. (2018) used a 15-point moving average to smooth the yield measurements of a load-cell type silage yield monitor. To eliminate vibration noise in a baler yield monitor, Wild and Auernhammer (1999) utilized spline smoothing and low-pass filtering. The delay between the time a fruit or vegetable is collected by the harvester and when it's registered by the yield sensor is known as harvester lag. It is essential to quantify and assess the duration and variability of this lag for each specific harvester and crop when performing yield mapping. For instance, Pelletier and Upadhyaya (1999) identified two-second delays in a tomato harvester due to fruit build-up and a three-second delay at the rear cross conveyor. To represent each of these delays, they used a first-order transfer function. In a pistachio harvester, Heidman et al. (2003) determined that the speed of the conveyor belt had the most significant impact on harvester lag. They managed to reduce the latency from around one minute to less than 10 seconds by increasing the conveyor belt speed. Nevertheless, research findings suggest that the transfer of materials within harvesters cannot be adequately explained by a mere time delay. Different components entering the harvester at various times tend to mix. Vellidis et al. (2001) found that a peanut combine took 45 seconds for the material to reach the basket after a one-second pulse input. They suggested defining harvester lag as the time it takes for 50% of the material to reach the basket. Durrence et al. (1999) explored mixing behavior and attempted to account for it using deconvolution techniques, but a simple time lag of 13 seconds yielded better results. Boydell et al. (1999) found that the deconvolution method was more accurate. They demonstrated that the deconvolution approach produced lower errors and better spatial resolution than using a time lag in their experiment involving a two-row peanut combine. In another study using a pecan harvester and yield monitor, Reyns et al. (2002) encountered mixing issues when pecans from different trees were collected simultaneously, resulting in overlap. They resolved this problem by identifying a peak in the yield monitor signal when the harvester was near a tree trunk. By evaluating the data, they found that a 4- to 6-meter window surrounding the tree trunk had the highest correlation (84.0% coefficient of determination) with the yield of the individual tree. Through this method, they could estimate the yield of each tree despite the mixing issue caused by the harvester.
Challenges and issues
Yield monitoring for specialty crops presents distinct issues, especially when mechanical damage sensitivity and significant temporal yield variability are considered. This manuscript delves into prior studies on yield monitoring in specialty crops. Mass flow rate sensors, which measure crop mass or impact force, have demonstrated accuracy across a wide range of crops. Batch and cumulative weighing systems also offer reliable measurements. To evaluate crop amount or flow rate, many monitoring systems include cameras, optical sensors, or similar technology. Although these systems require more sophisticated processing than load cell signals, they have proven to be efficient in correctly estimating yields for various crops. To estimate yield, yield estimation methods estimate crop volume or count the number of fruits and vegetables. Advanced crop production prediction using tree canopy volume or spectral features has proven relatively successful for citrus and grapes. Pre-harvest yield estimation can be achieved using these approaches.
Conclusion
Over the past thirty years, advancements in sensing technologies and machine learning techniques have progressed at a rapid pace. Yield monitoring systems have been designed to cover a broad spectrum of crops, including non-grain crops, grains, forages, root crops, and citrus. Throughout this timeframe, significant improvements have been made in both the individual components and the overall performance of these systems. Notably, a significant emphasis has been placed on major non-grain crops such as cabbages, radishes, potatoes, tomatoes, and others. A review of research trends highlights various approaches to yield monitoring for non-grain crops. One common observation is the categorization of flow sensors into mass flow sensors and volume flow sensors, typically installed at the top of non-grain elevators to measure flow. Mass flow sensors utilize techniques like weighing, force impact, or radiometric methods, while volume flow sensors are available in forms such as paddle wheels or optical sensors. Numerous factors, including crop type, farming methods, harvester requirements, and economic constraints, have an impact on the range of yield monitoring sensors. In selecting an appropriate approach, one must consider these factors carefully, keeping in mind that the performance of each sensor type may not apply to every crop and harvester. For real-time data analysis and post-processing to ensure yield mapping accuracy, factors such as machine vibrations and field slopes must also be considered. Continued developments are likely to make vast datasets available at lower costs along with ever-more-advanced algorithmic solutions. As a result, crop and environmental condition evaluations will be more accurate, supporting better-informed decision-making.
